
White cursive text that says 'Galson's' on a black background.

  • Conducted four qualitative interviews through targeted cold outreach

  • Distributed quantitative surveys through creative and diverse recruitment channels

  • Analyzed data to identify key drivers of Gelson’s low growth rate

  • Oversaw storytelling flow and visual design of the final client presentation

Led a mixed-methods research campaign for Gelson’s, combining shop-alongs and surveys to uncover customer values and brand perception. Found that while Gelson’s is seen as premium and high-quality, low awareness limits growth. Delivered strategies in social media and local partnerships to strengthen visibility and competitiveness.
Title slide of a presentation with orange background, white text, and names of authors, titled 'Gelson's Market Research Findings'.
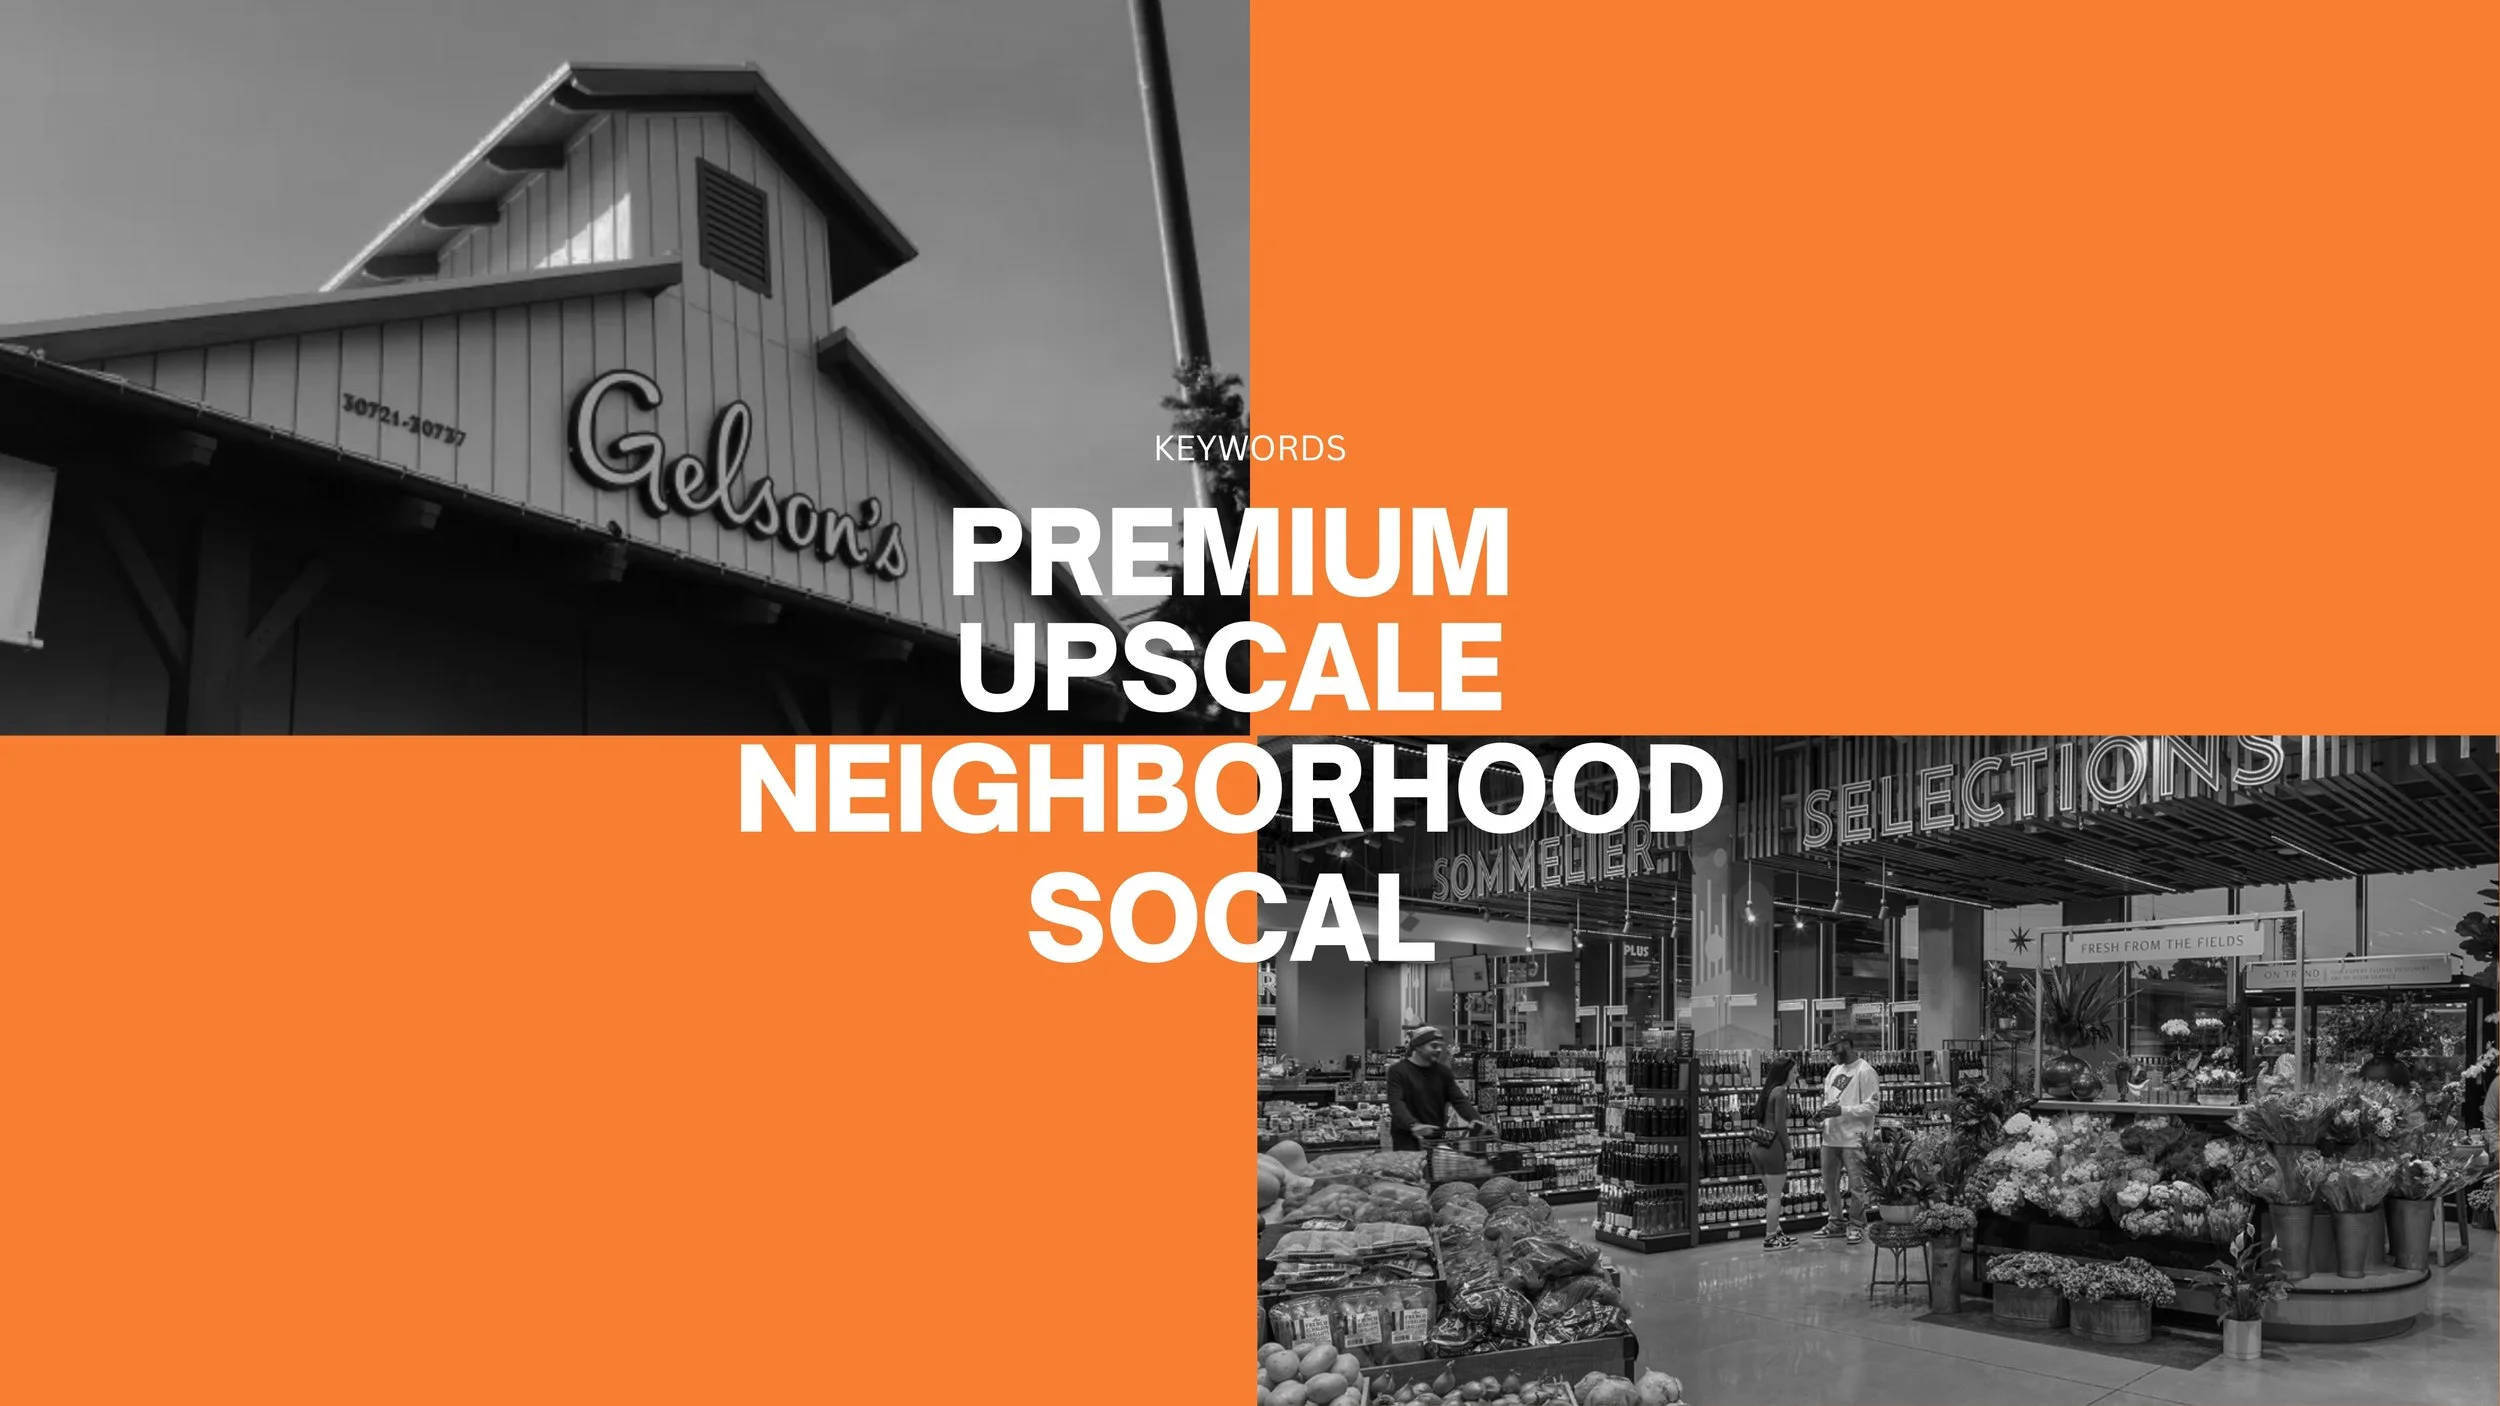
The image features a shopping plaza with a partial view of a store called Gelson's, a grocery store, and a produce section with fresh fruits and vegetables. The photo is in black and white, and there is a bold orange overlay with text emphasizing keywords like 'Premium,' 'Upscale,' 'Neighborhood,' 'Social,' and 'Socal,' highlighting a focus on an upscale neighborhood social environment.
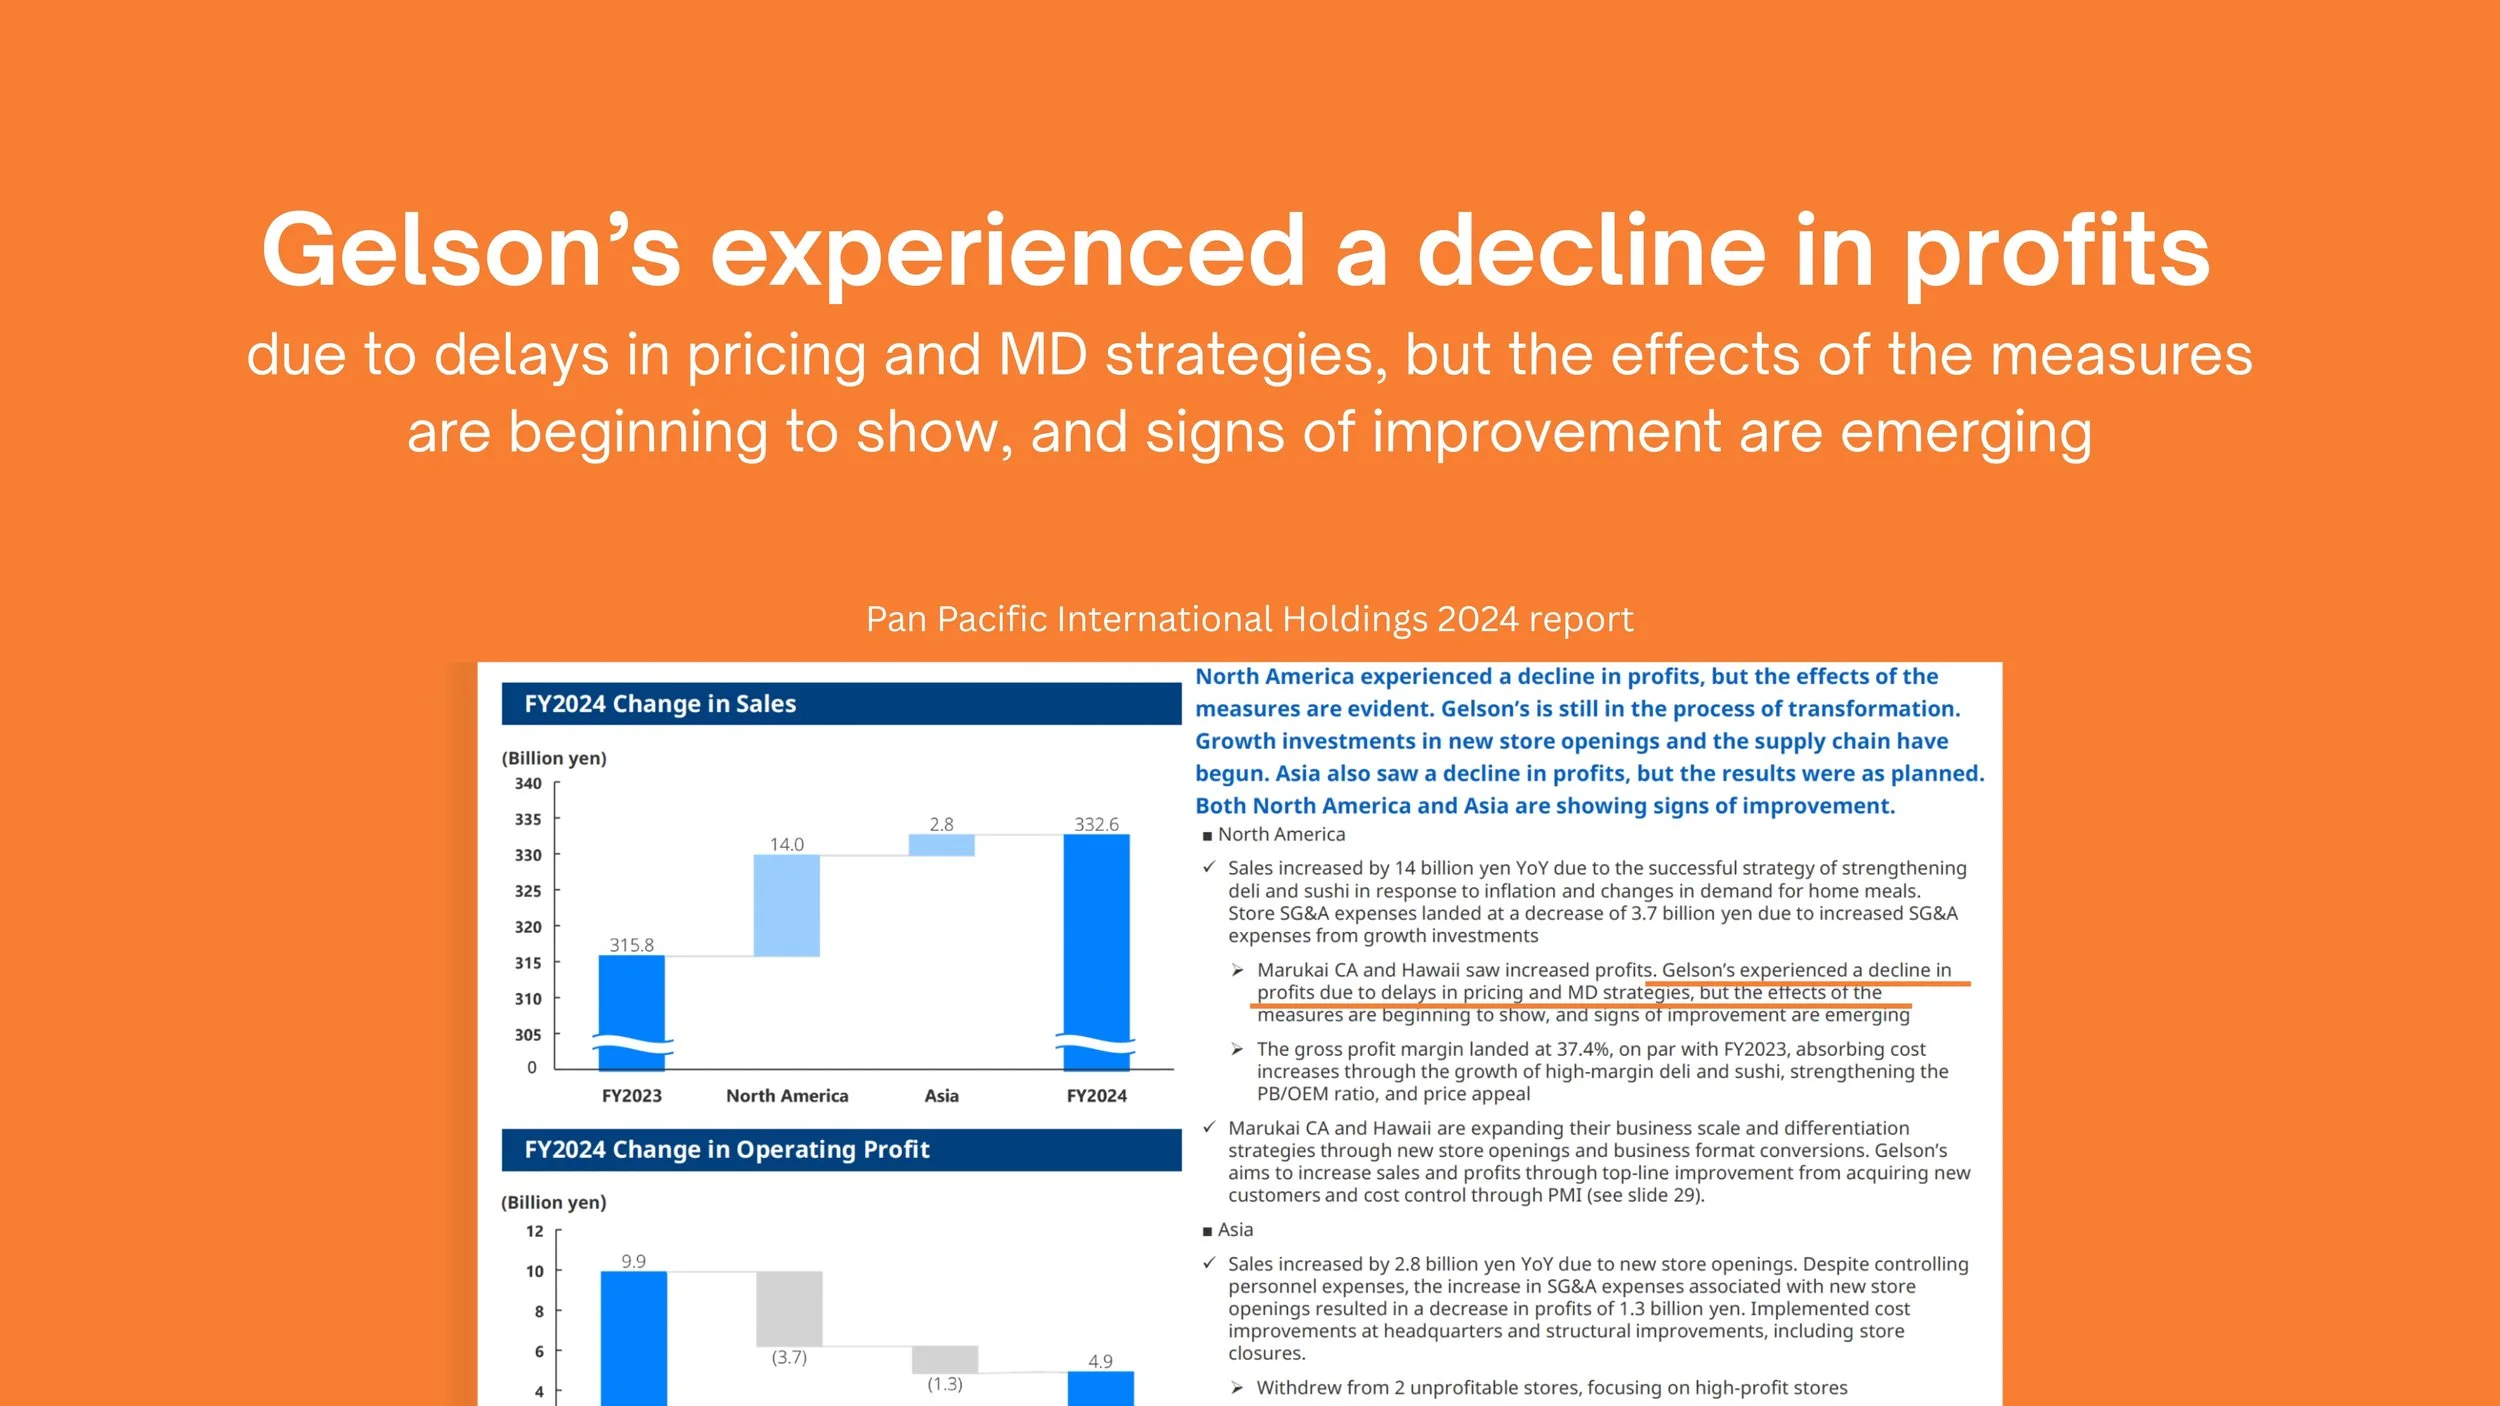
A report page with an orange background titled 'Gelson’s experienced a decline in profits due to delays in pricing and MD strategies, but the effects of the measures are beginning to show, and signs of improvement are emerging.' The page includes charts and text discussing the financial performance of Gelson's, focusing on sales and profitability changes.
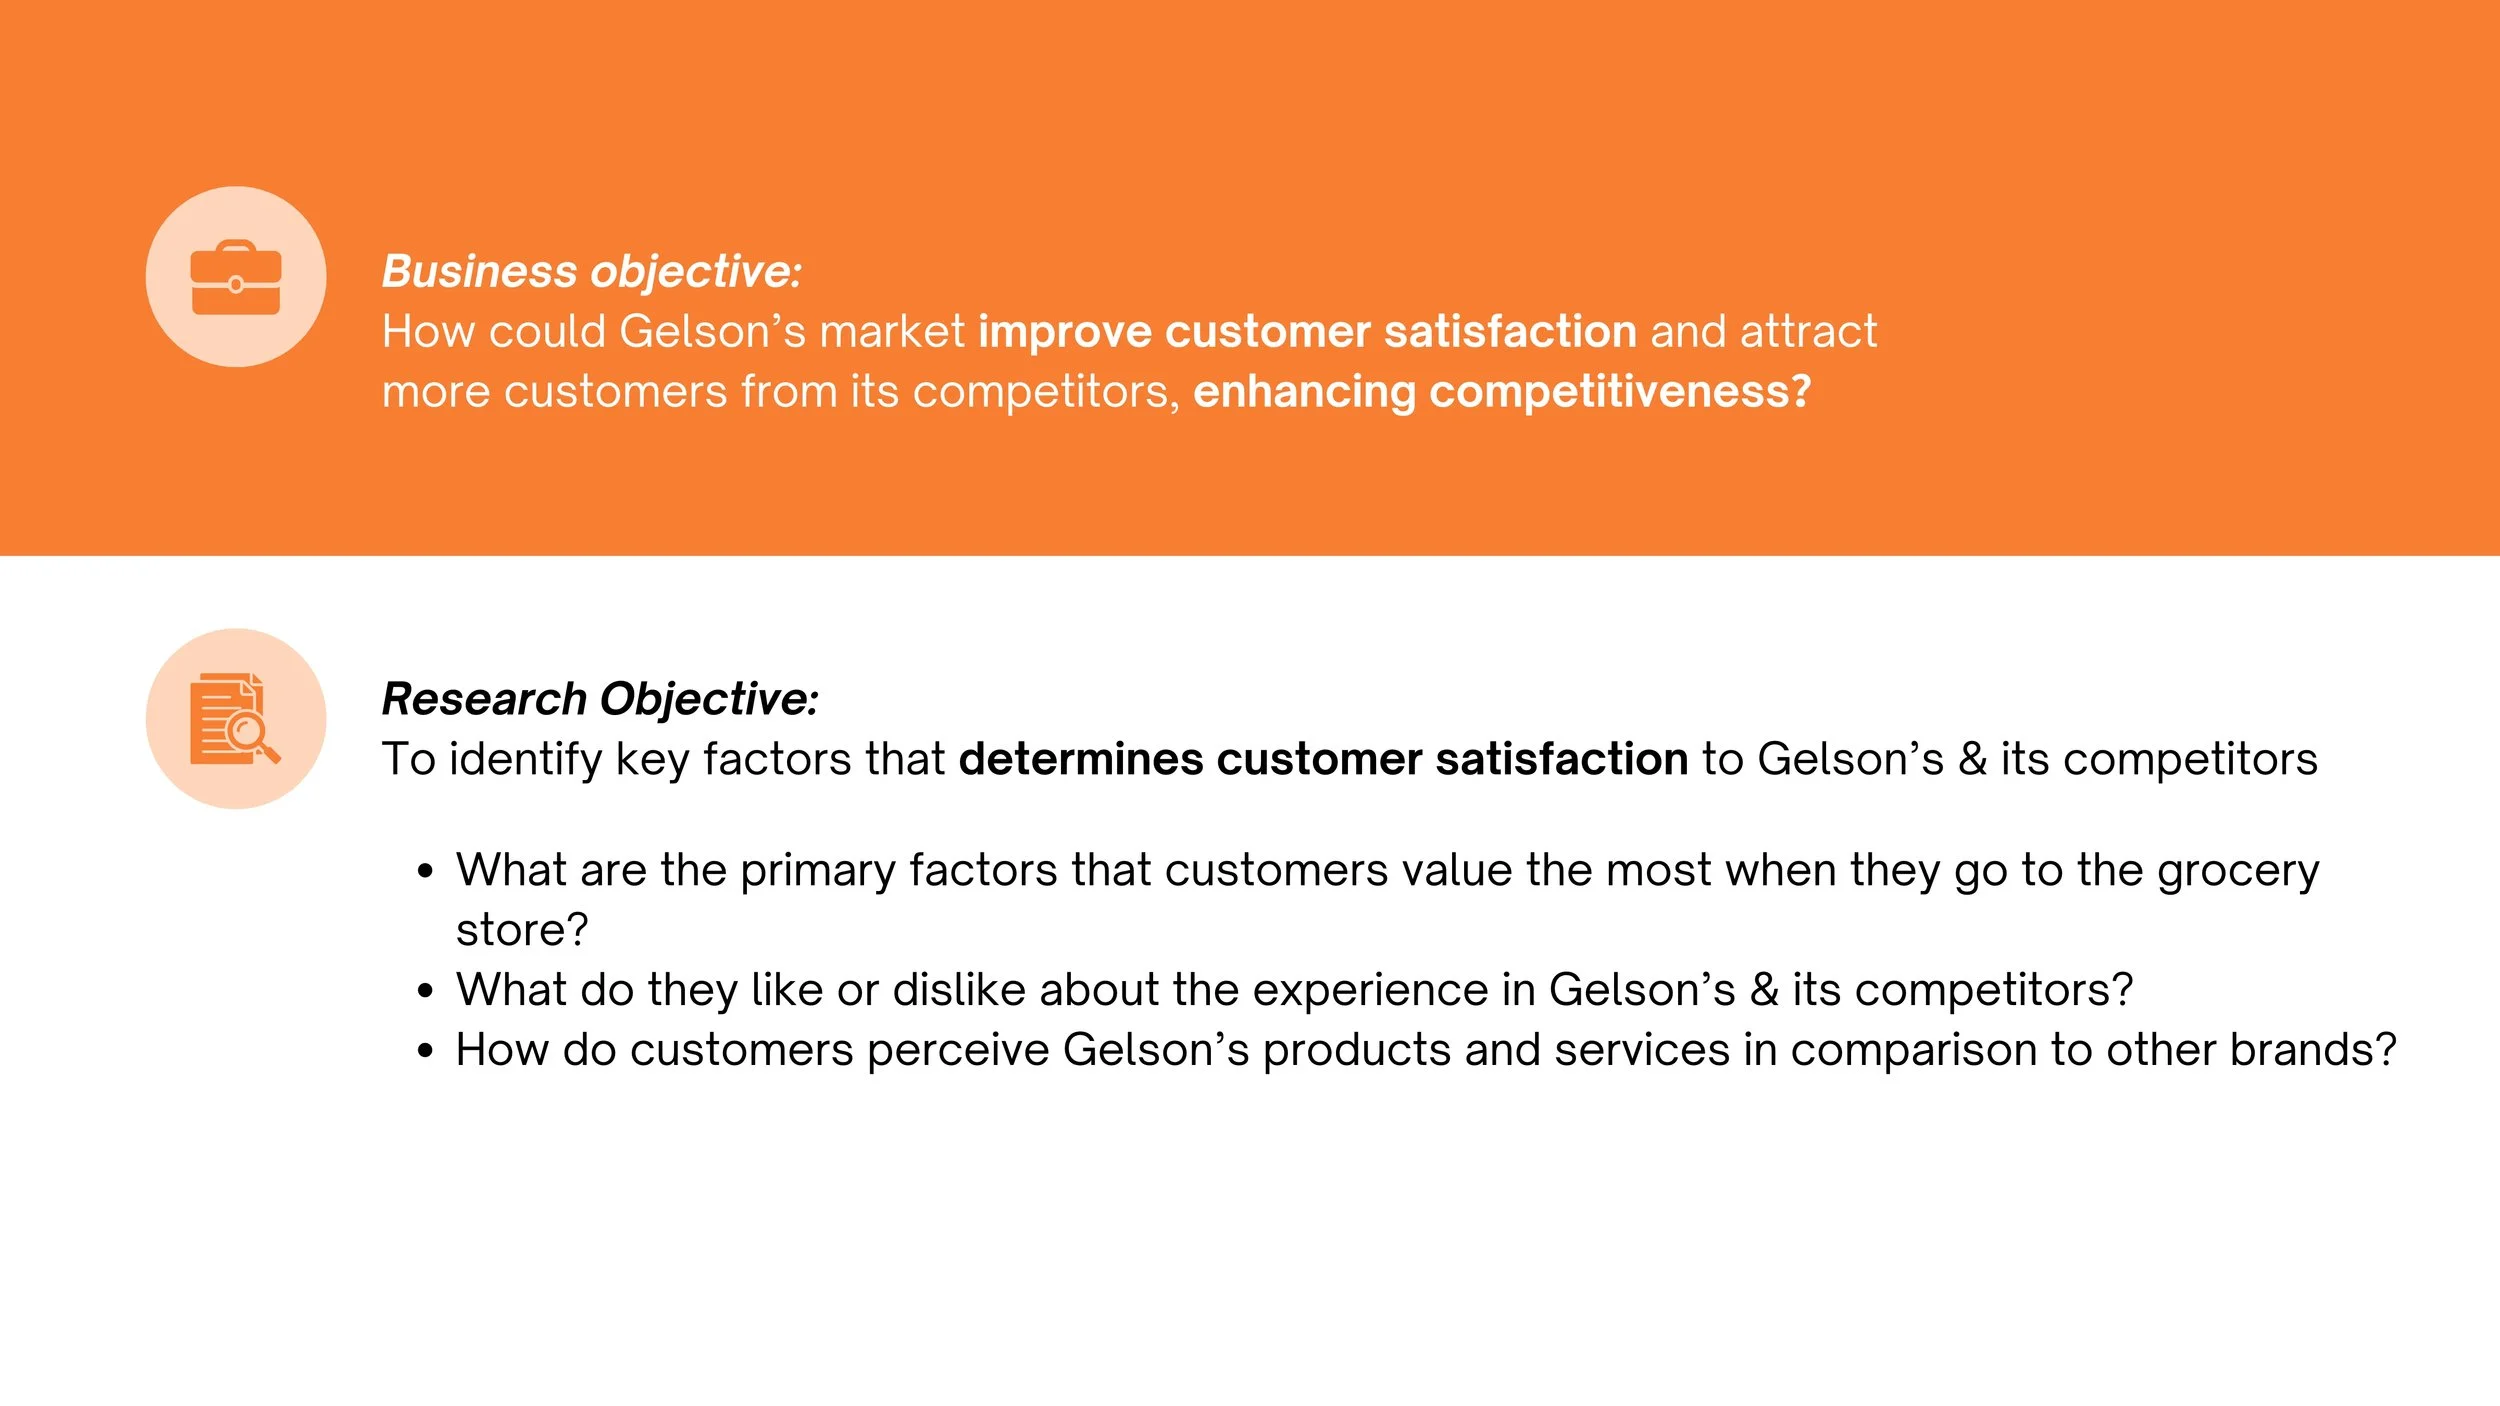
Presentation slide with orange and white background, featuring icons of a briefcase and a document, and text discussing business and research objectives related to customer satisfaction and competitiveness.
Slide titled 'Shop-Along Observation' with subtitle 'Qualitative research method' in black text, and key phrase in bold orange text on a white background.
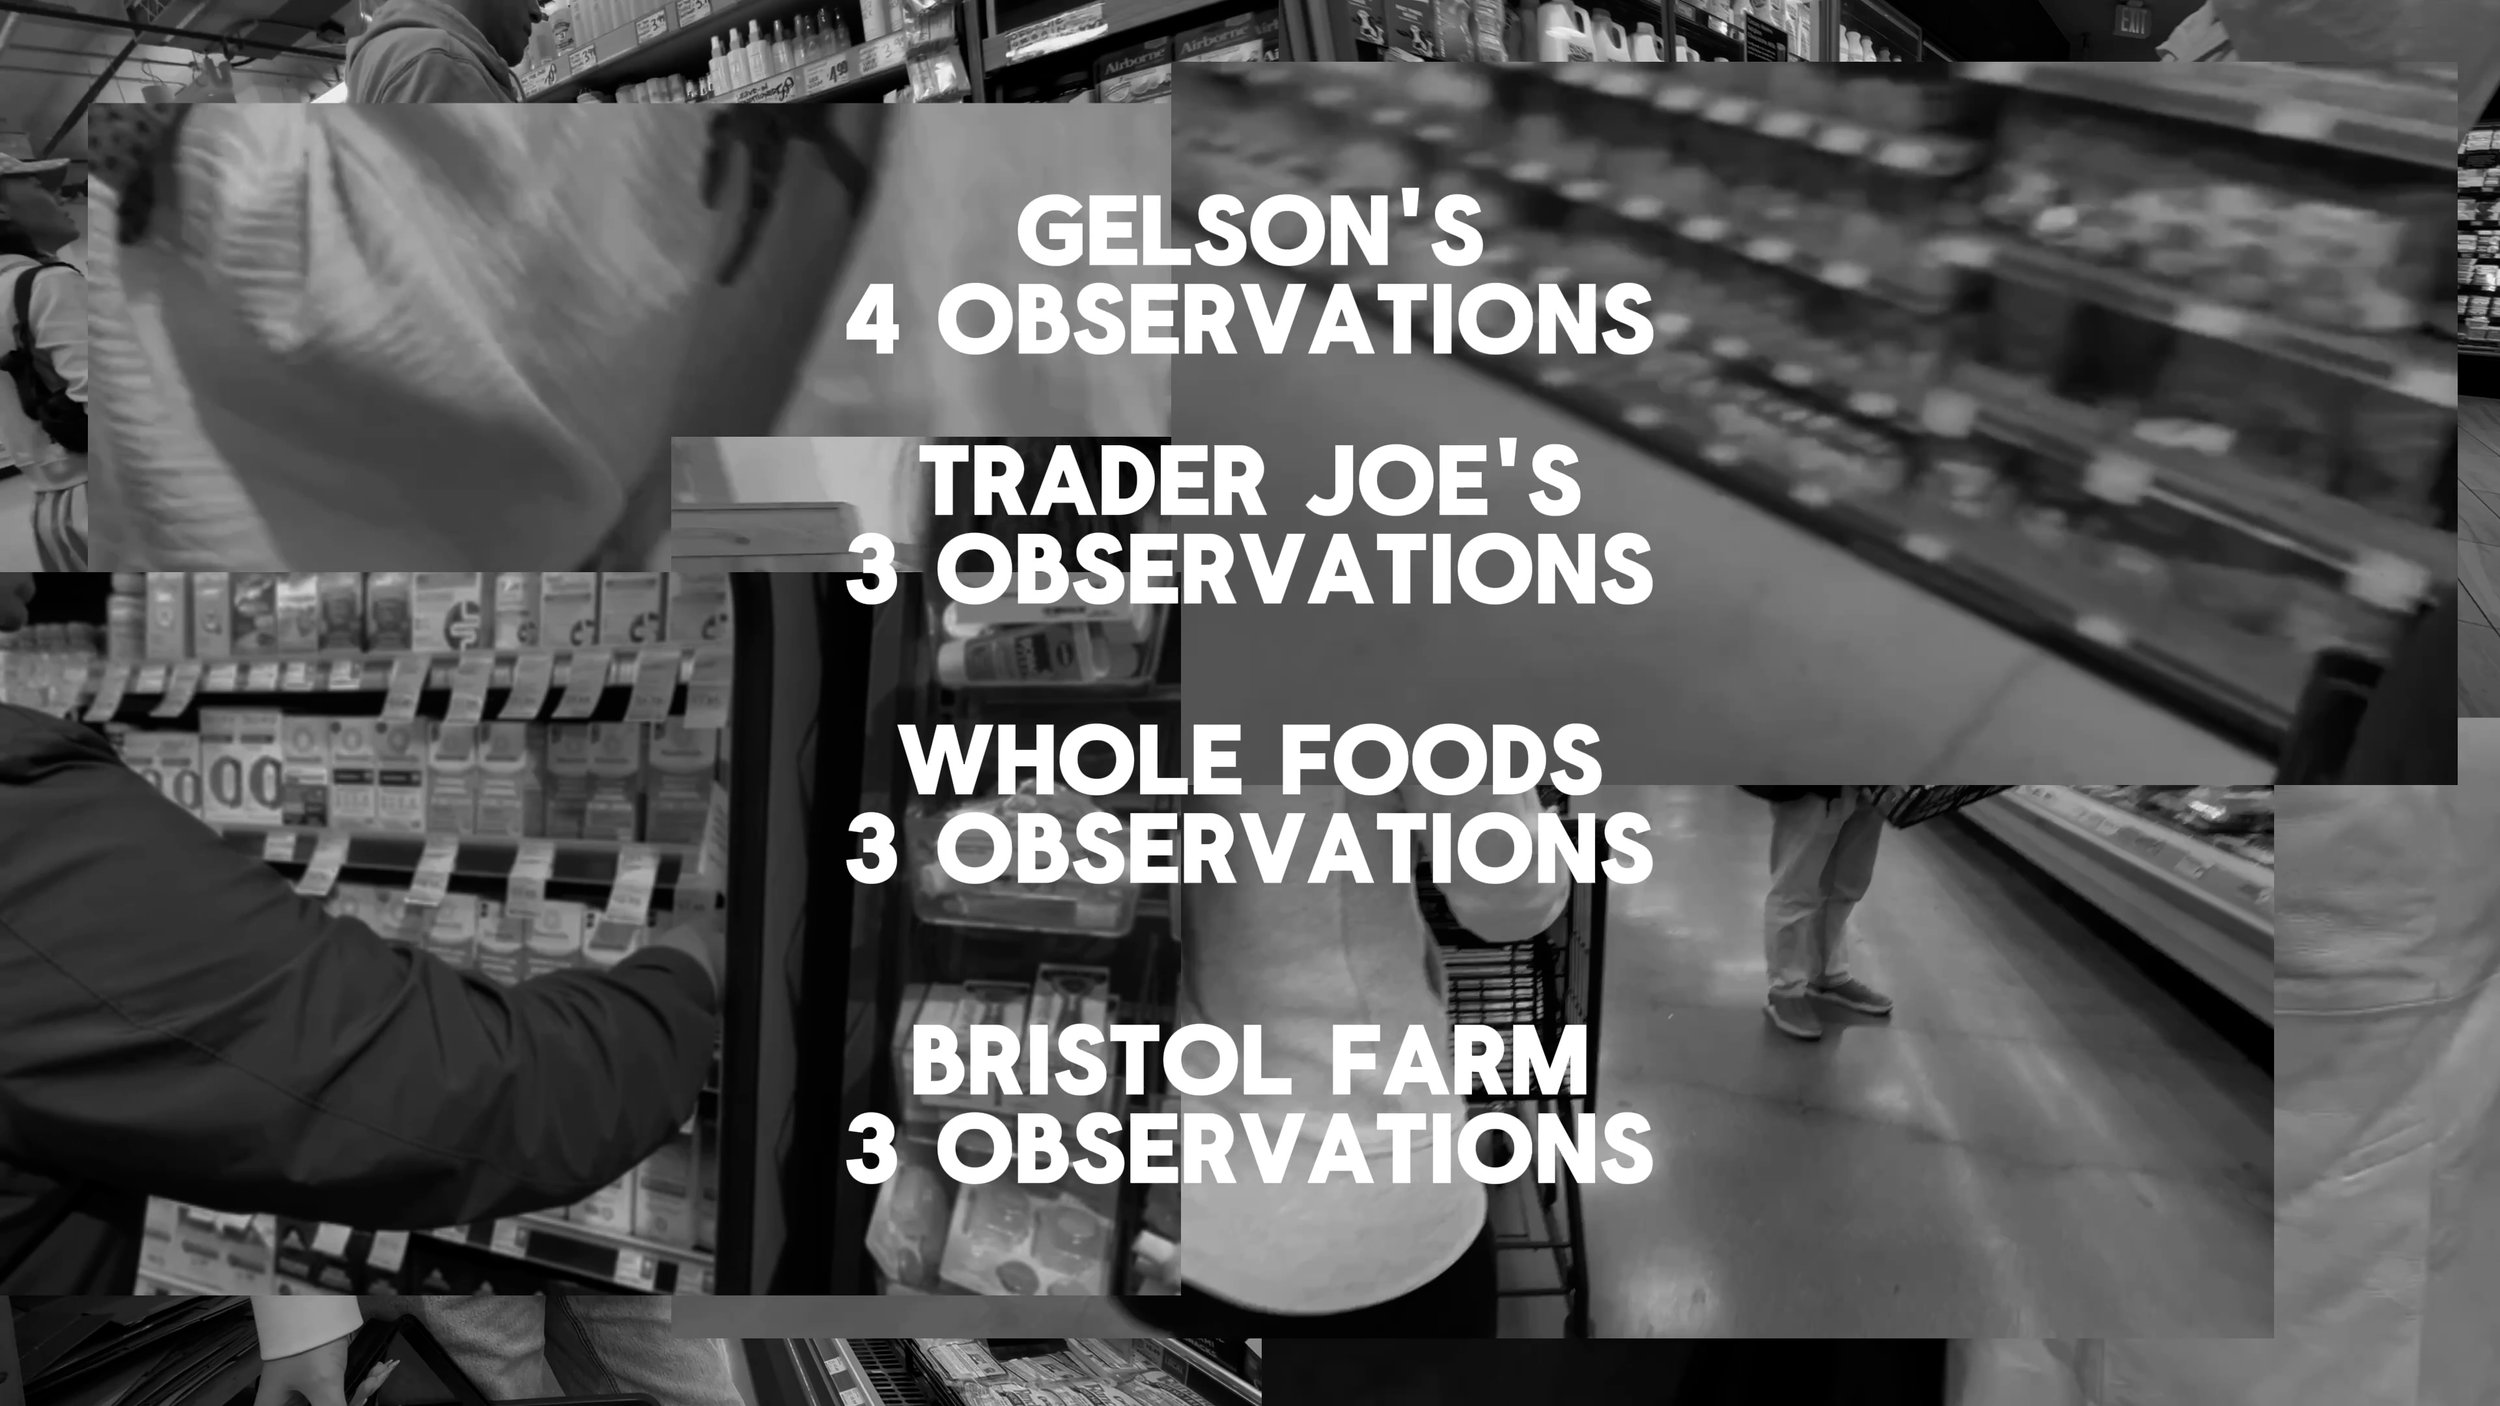
Black and white photo of people shopping in grocery stores with overlaid text listing observations about Gelson's, Trader Joe's, and Bristol Farm stores, including the number of observations made for each.
Title slide with black text reading 'Quantitative research method' and large orange text 'Awareness, Attitude and Usage survey'.
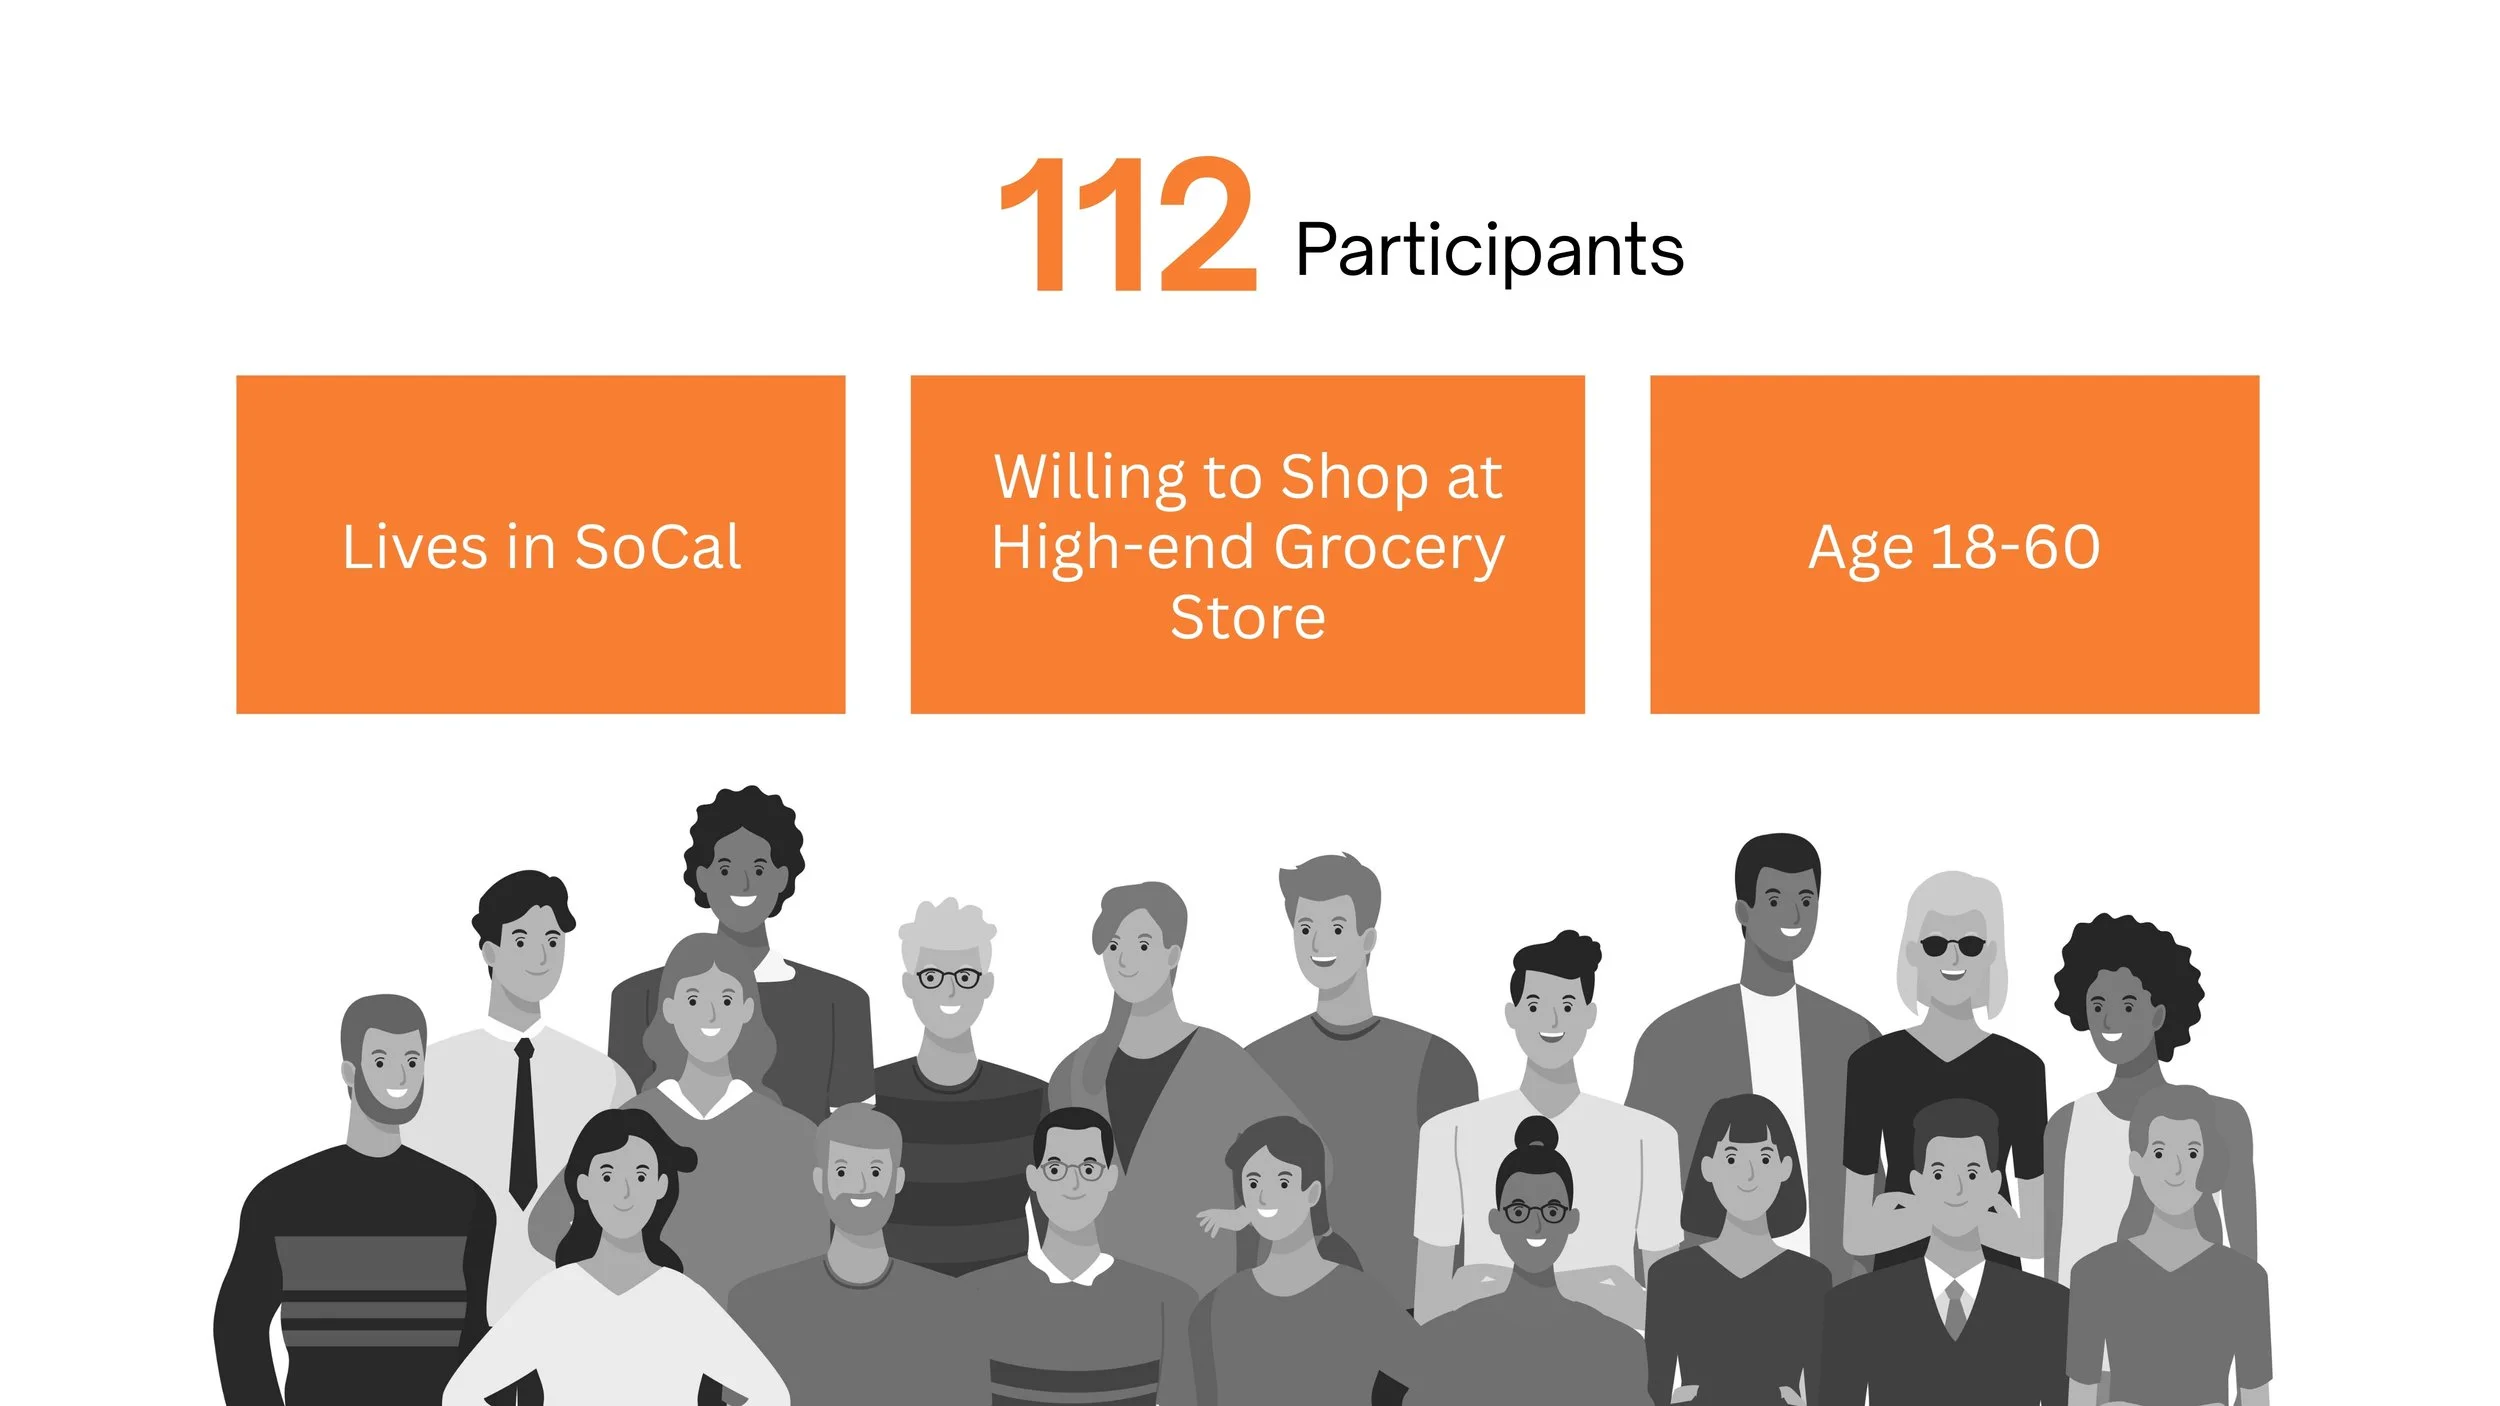
Graphic showing 112 participants, including diverse adults and children, with some in grayscale and others in color.
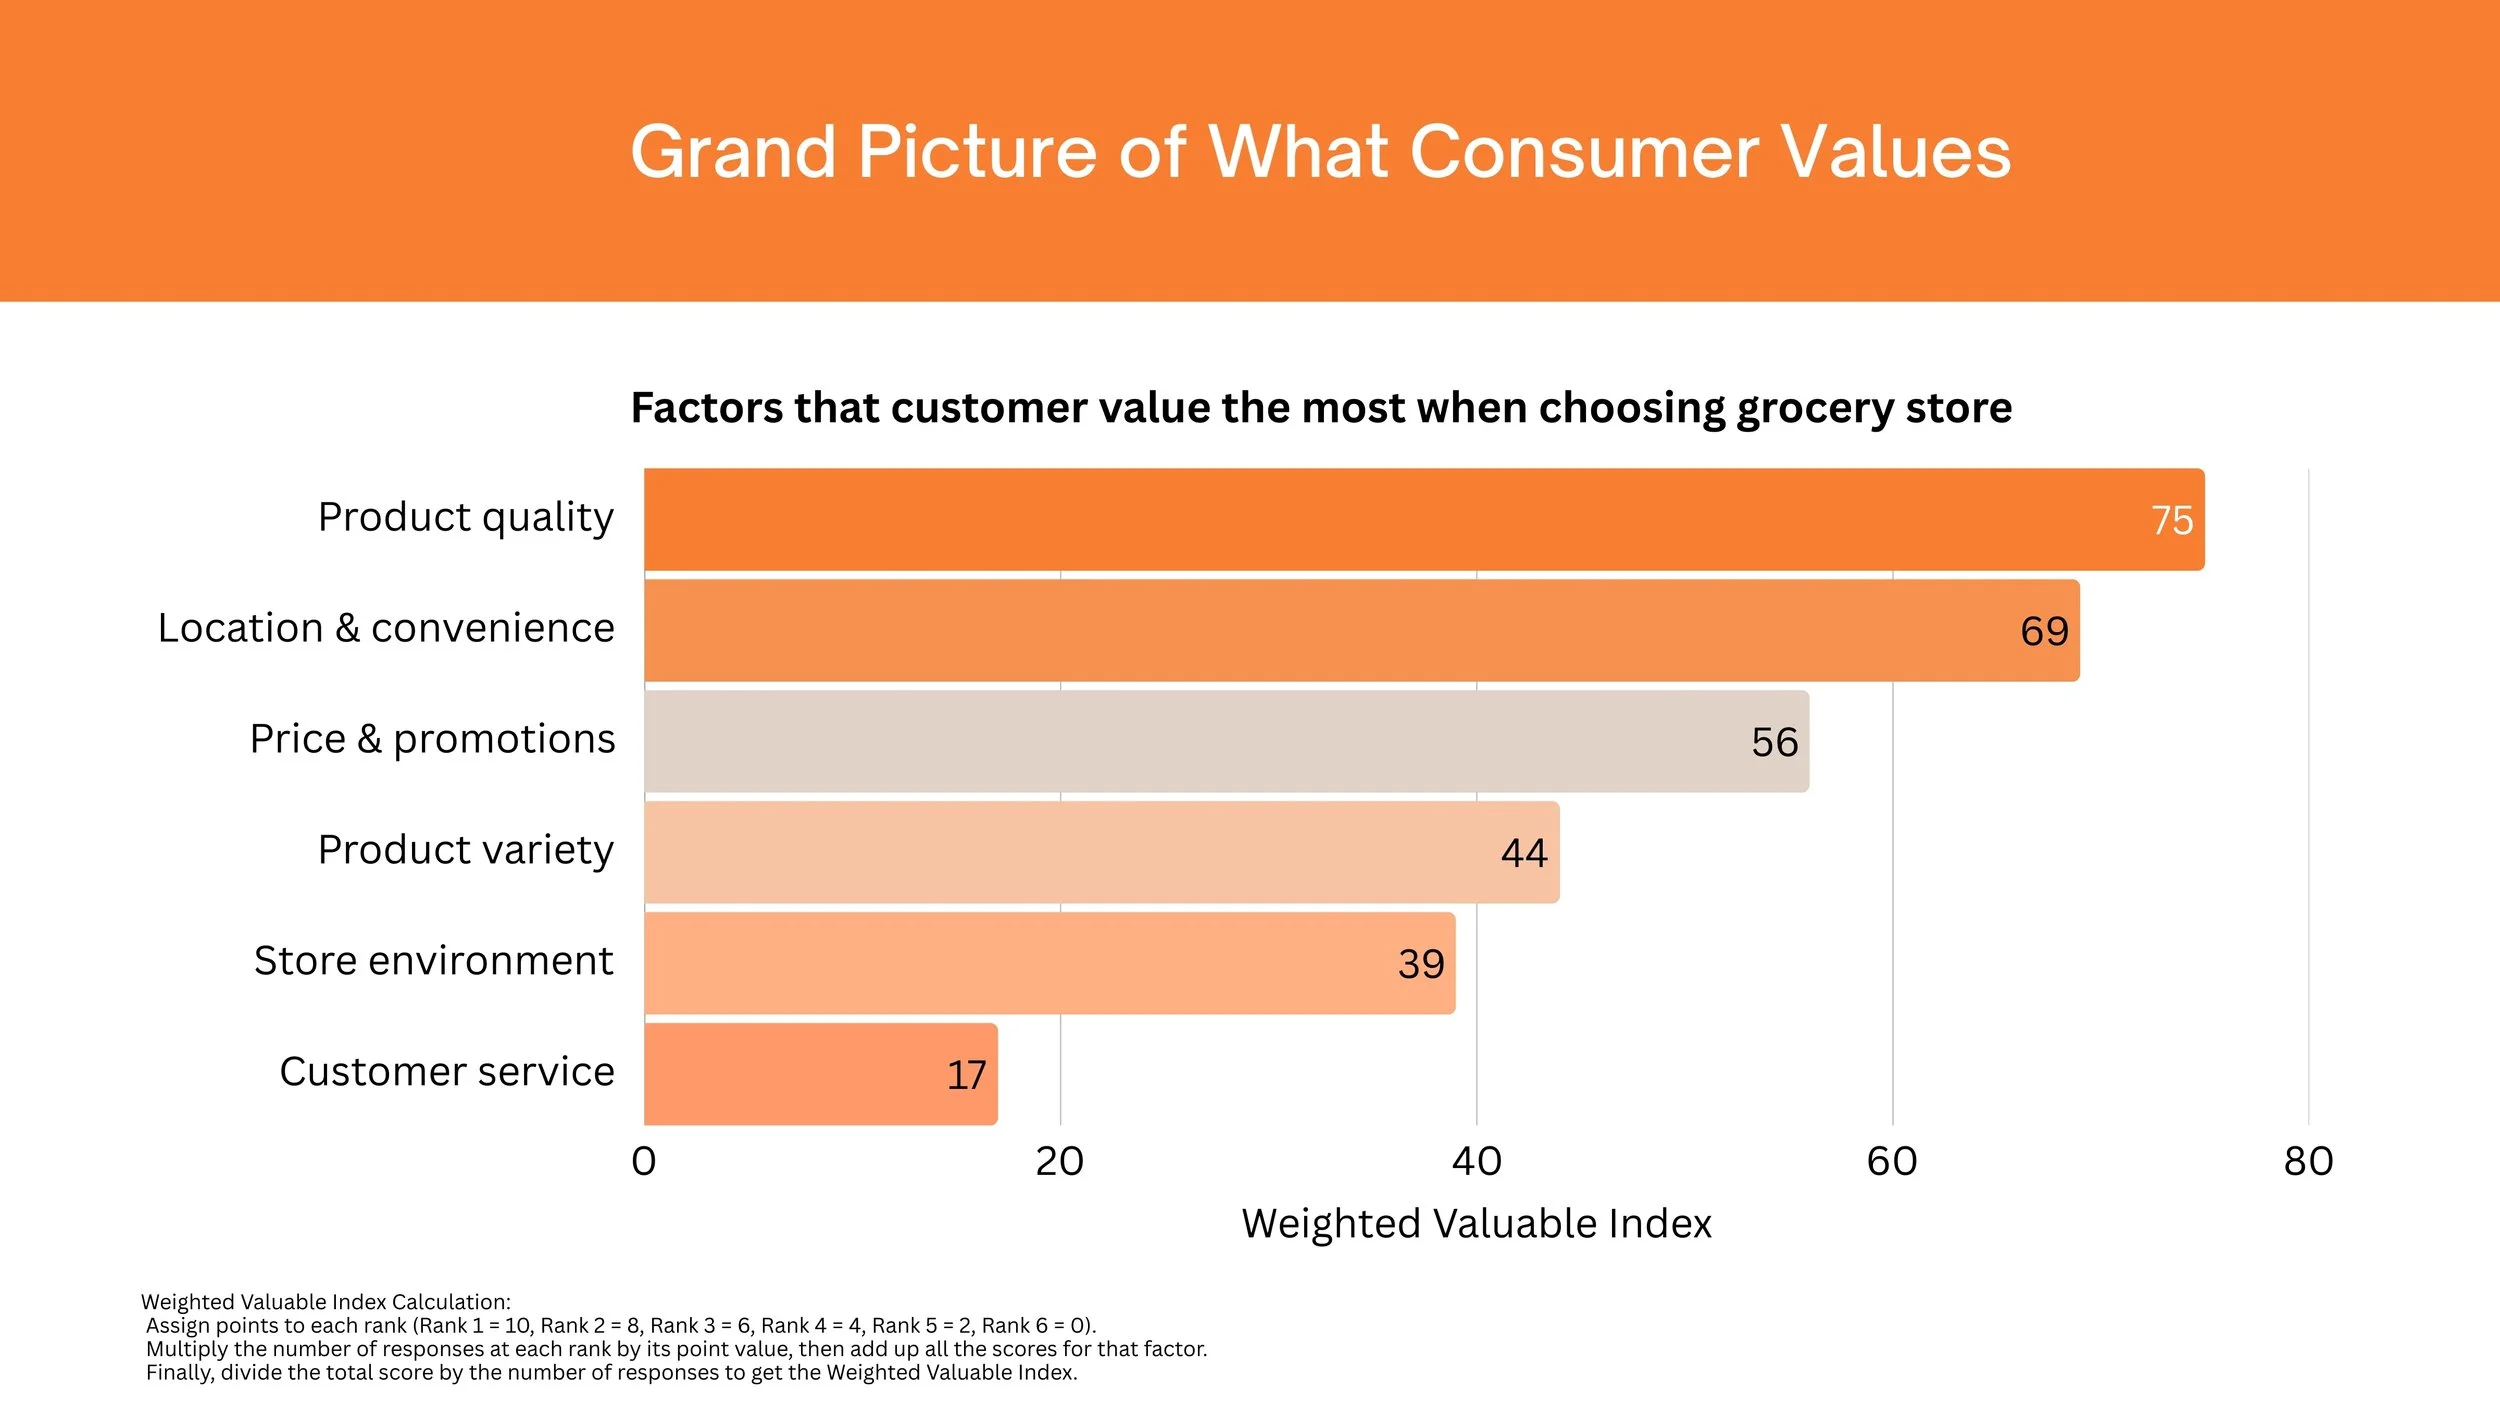
Bar chart titled 'Grand Picture of What Consumer Values,' showing factors affecting grocery store choice with weighted valuable index scores. Factors listed are 'Product quality,' 'Location & convenience,' 'Price & promotions,' 'Product variety,' 'Store environment,' and 'Customer service,' with corresponding scores of 75, 69, 56, 44, 39, and 17.
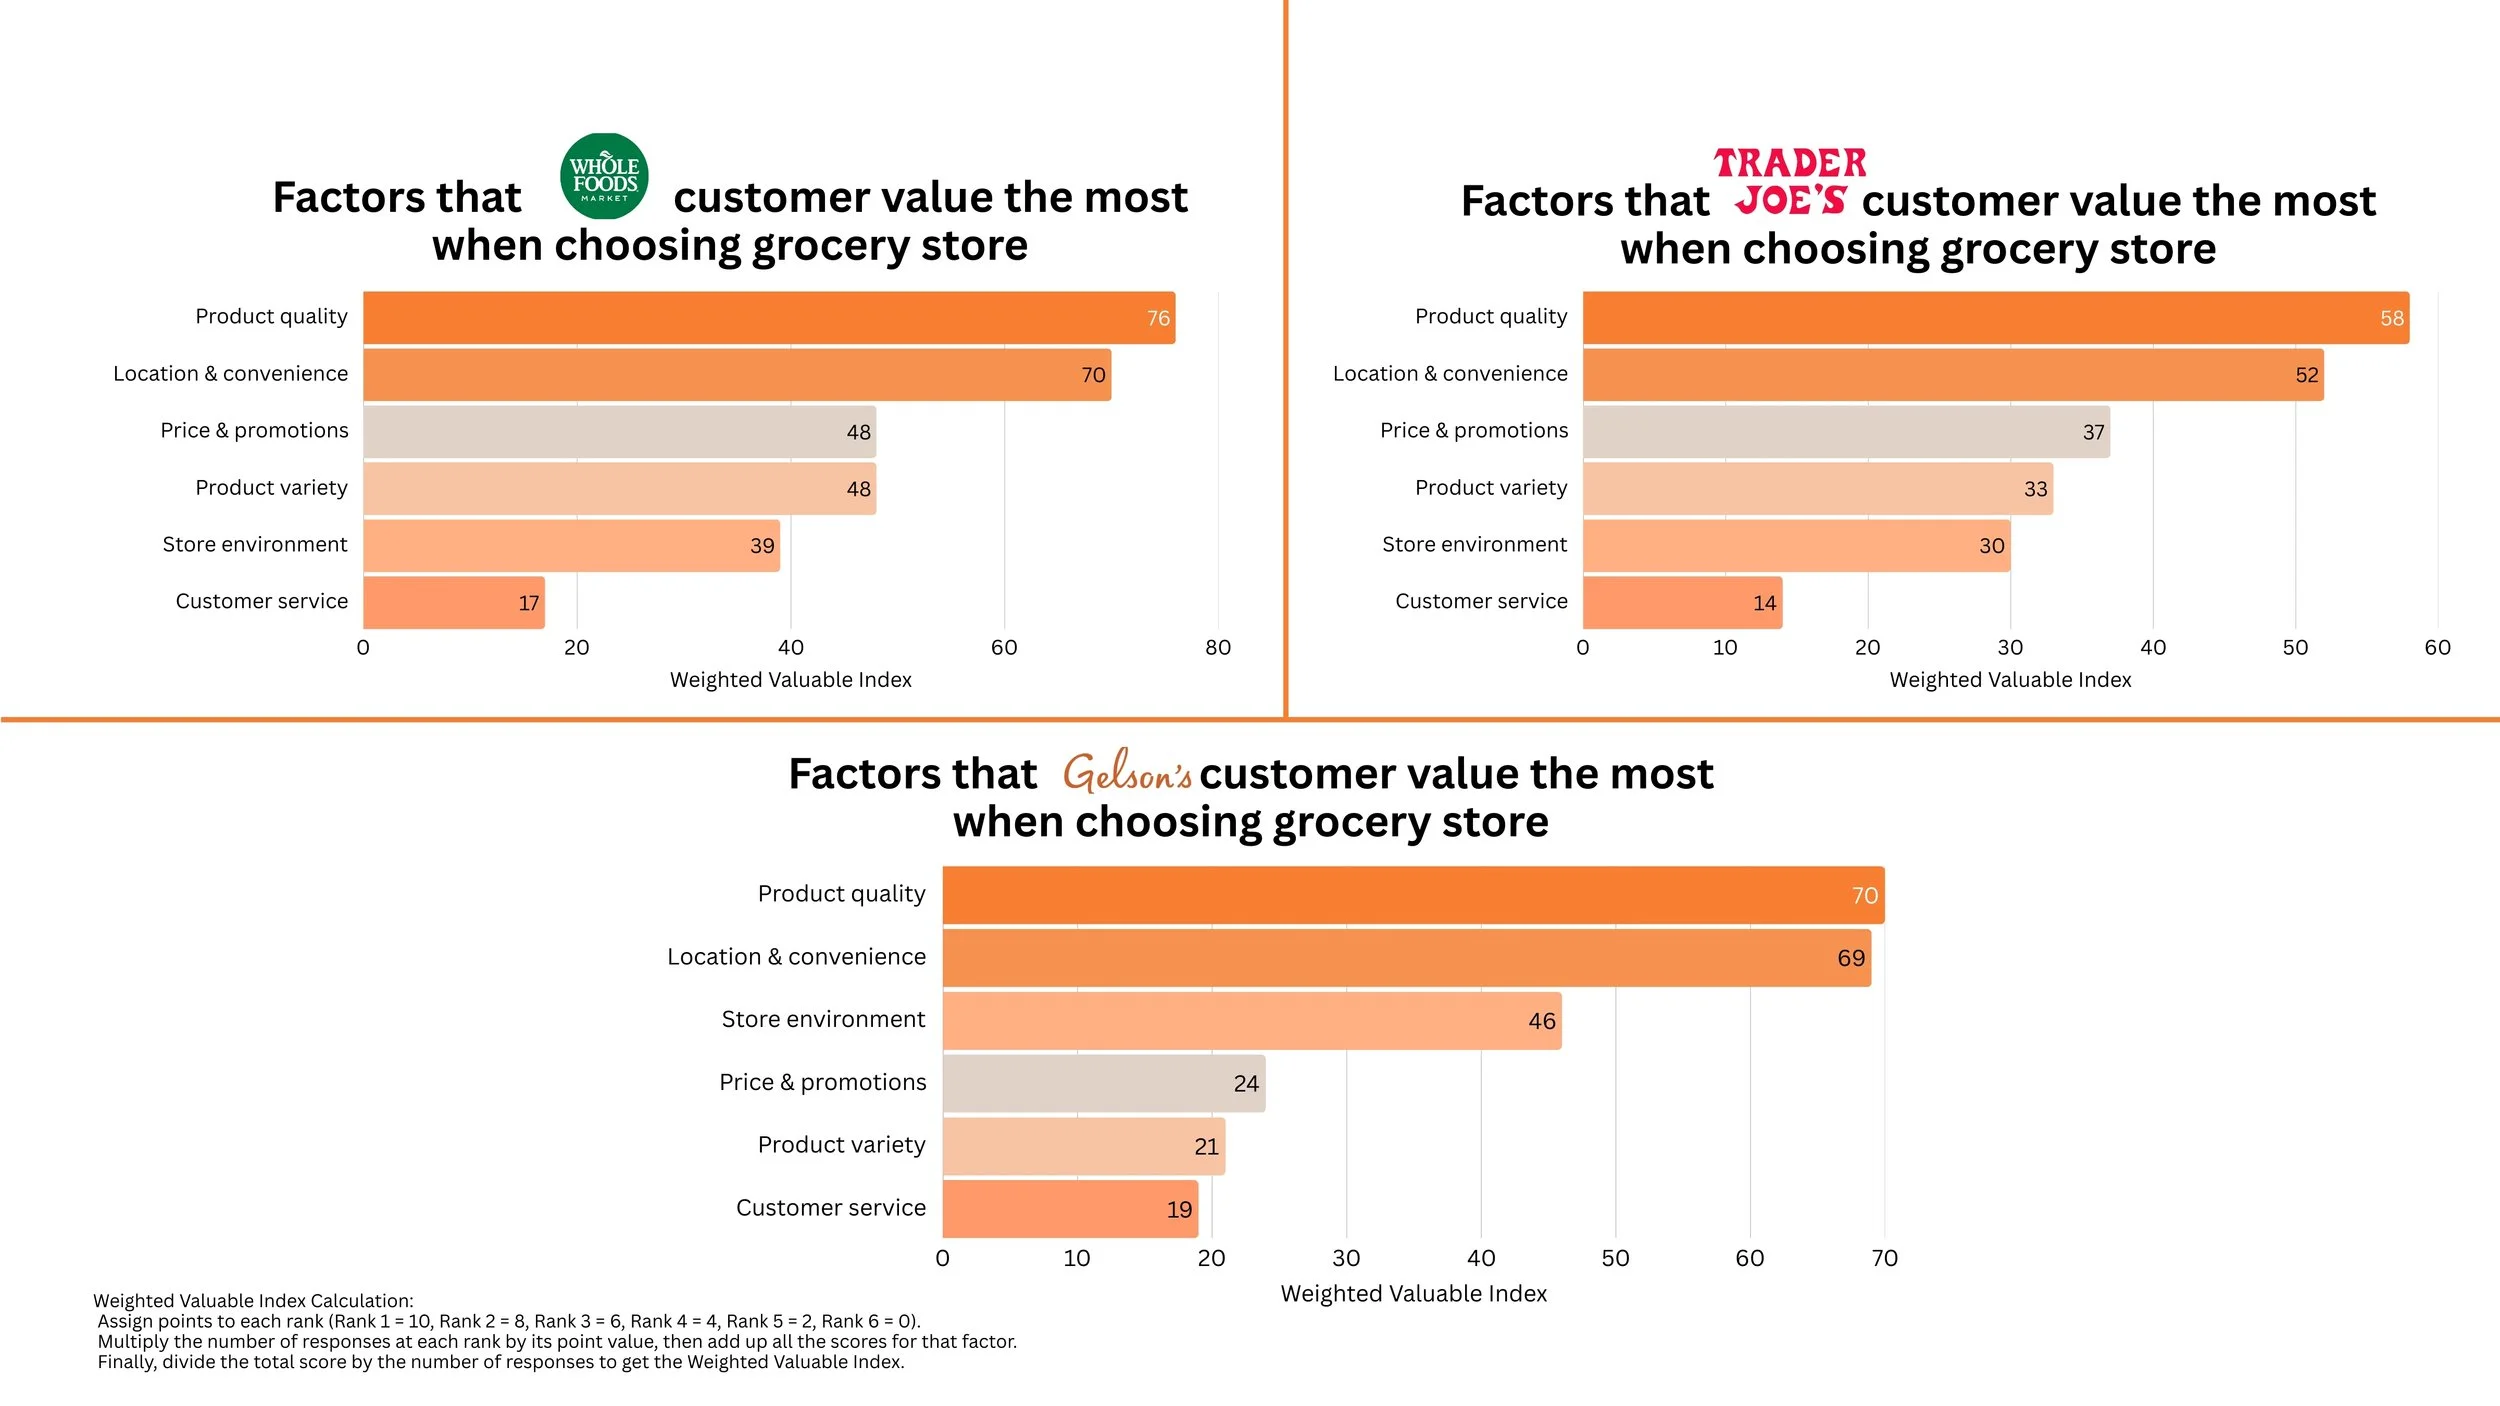
A comparison of factors favored by customers when choosing grocery stores for three different chains: Whole Foods Market, Trader Joe's, and Gelson's. The factors include product quality, location & convenience, price & promotions, product variety, store environment, and customer service, with corresponding weighted values for each chain.
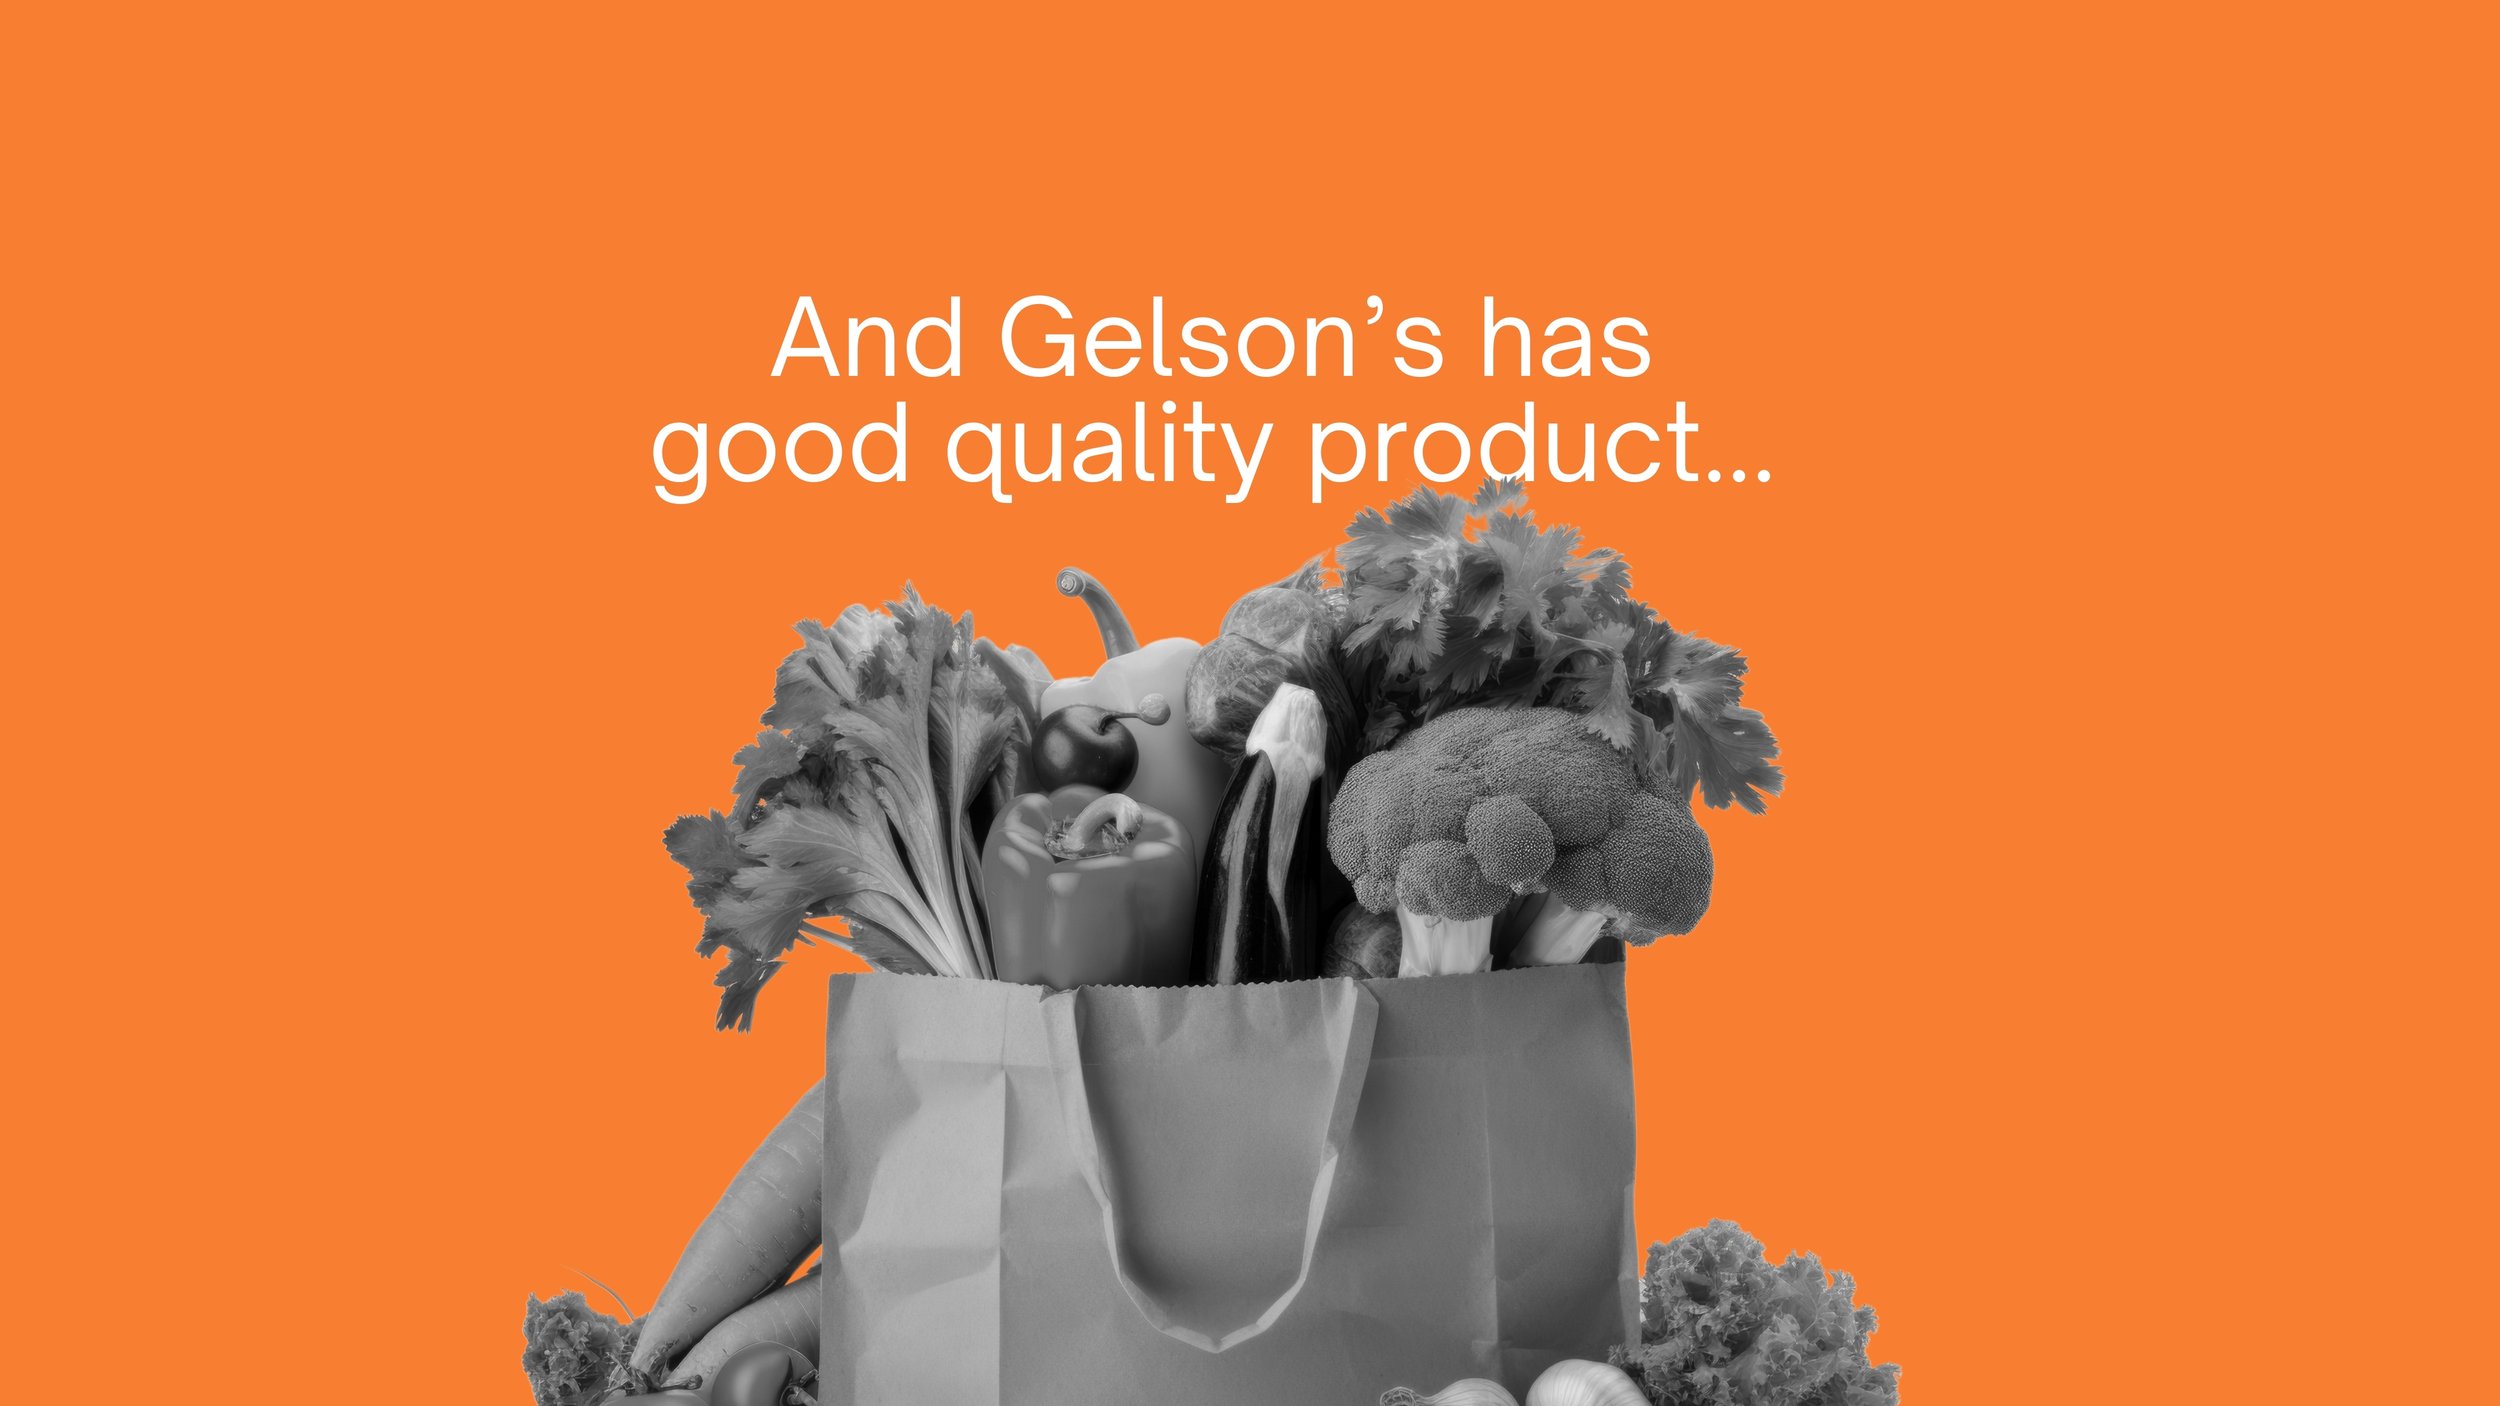
A paper bag filled with various vegetables, including leafy greens, bell peppers, and broccoli, set against an orange background with text that reads 'And Gelson's has good quality product...'
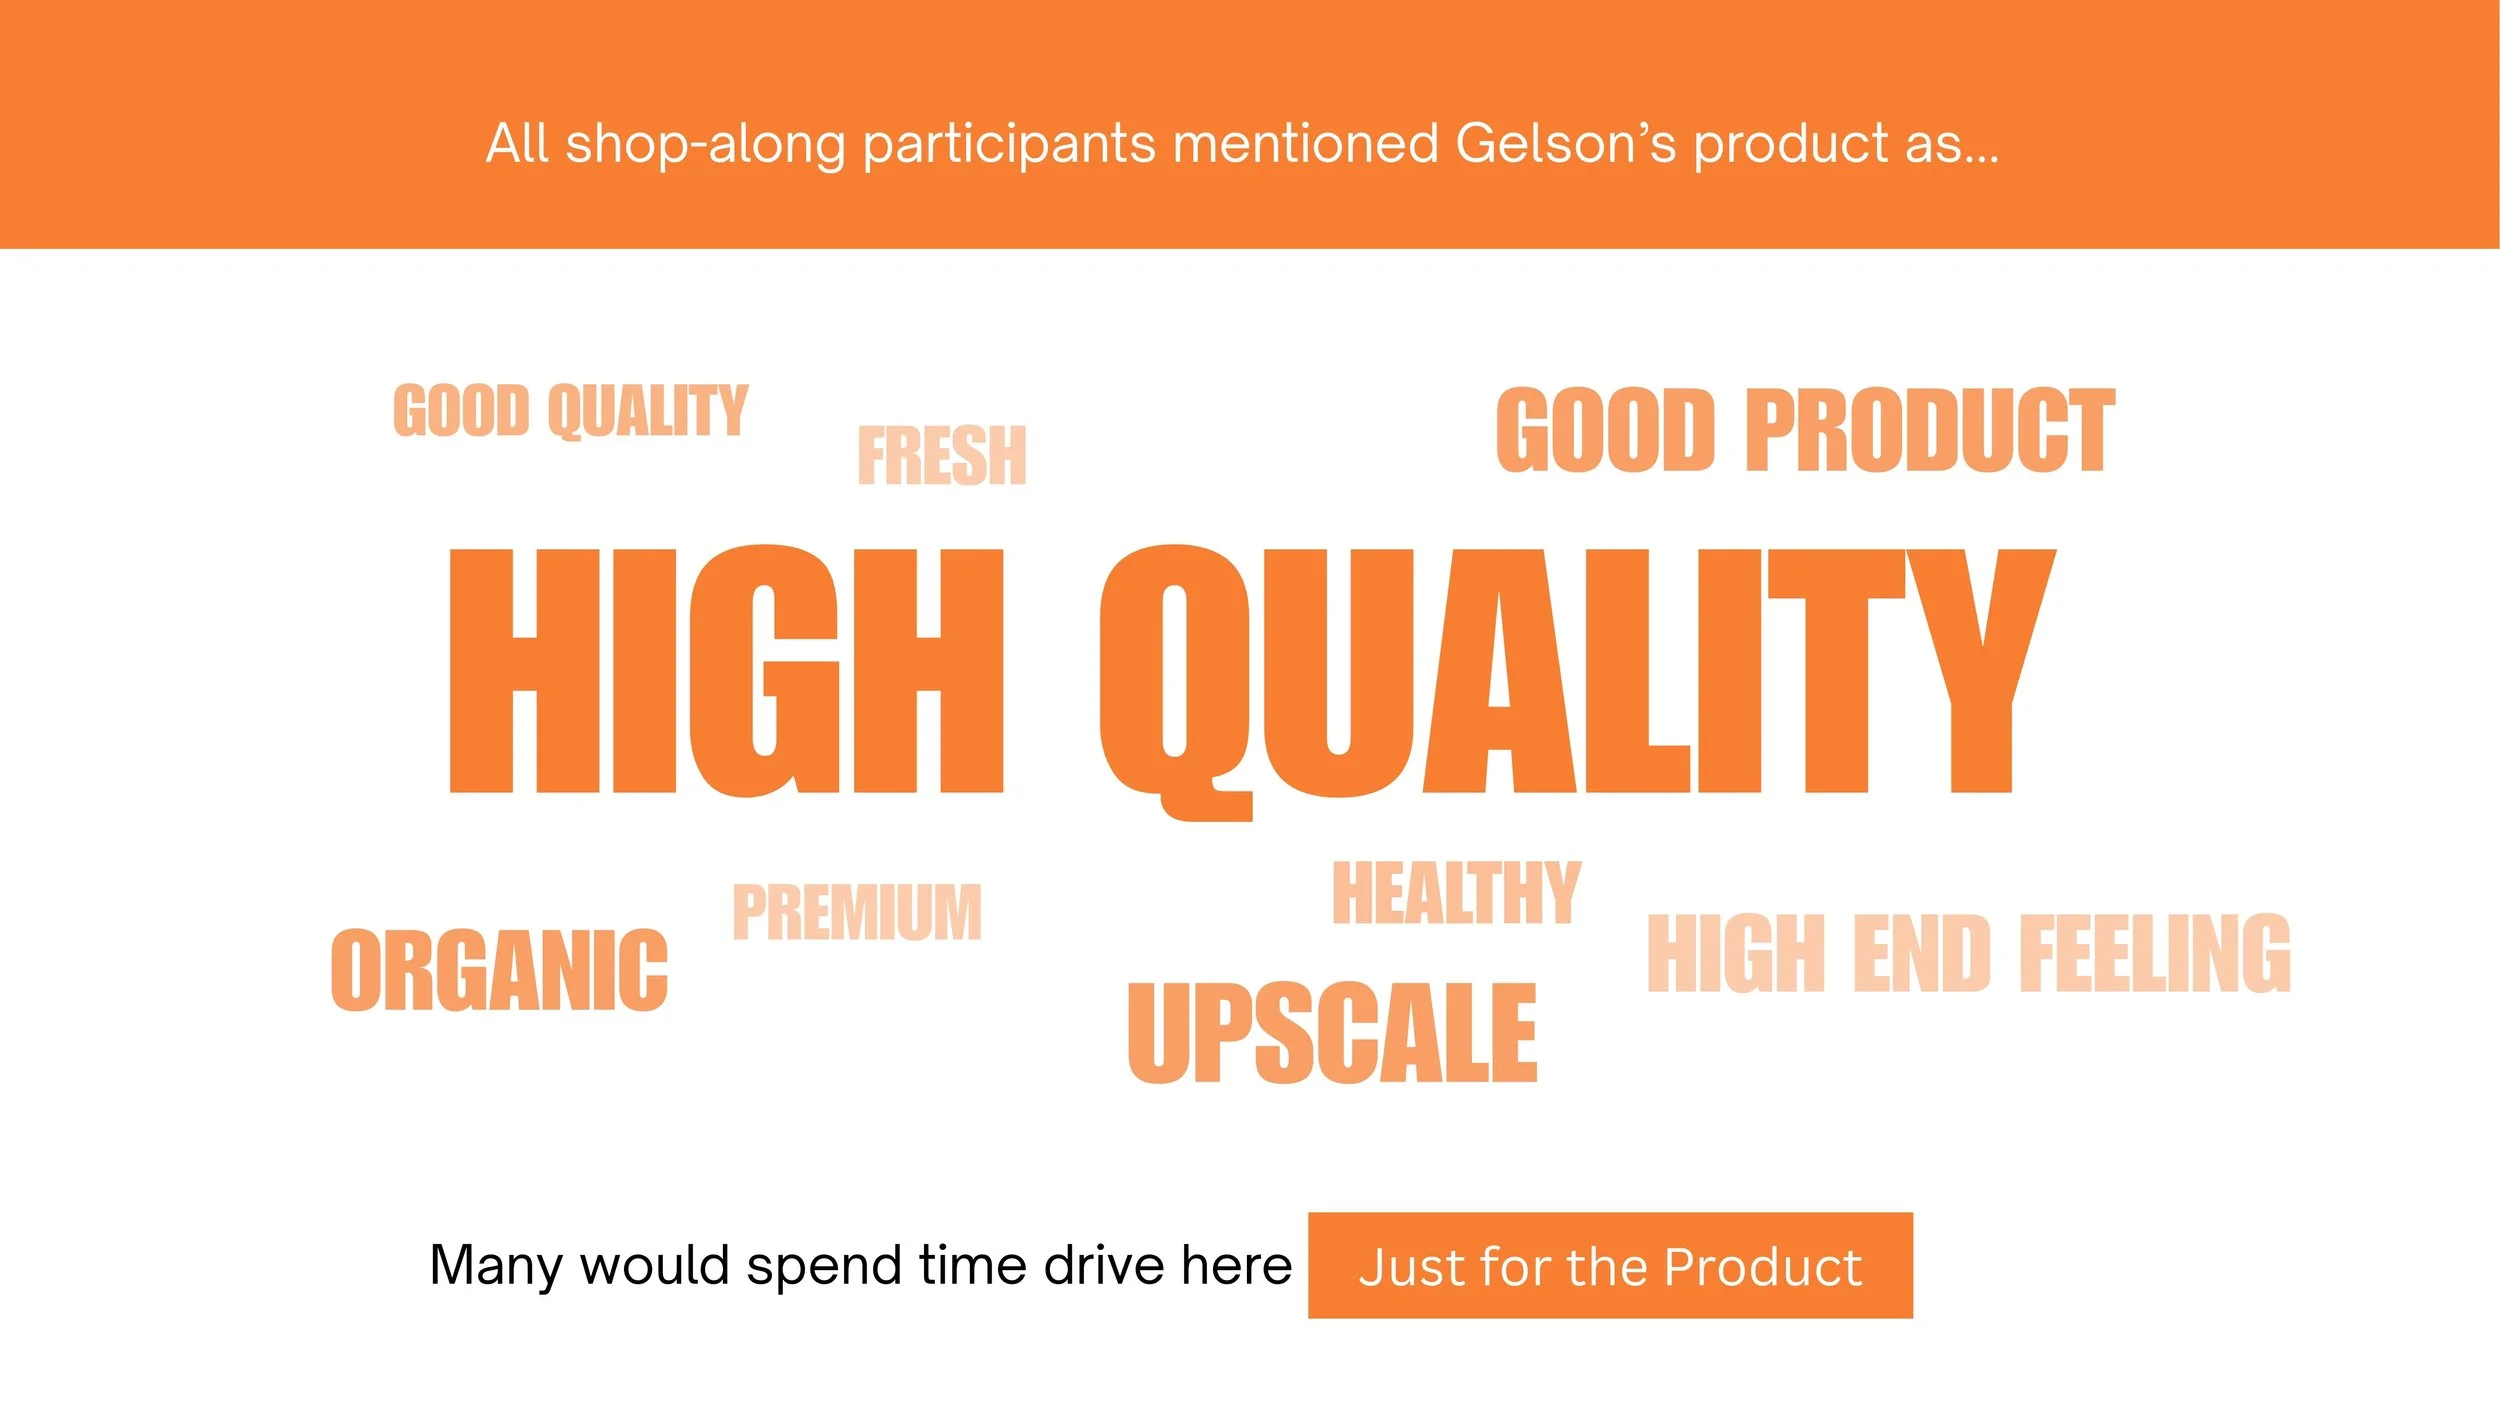
A visual graphic highlighting keywords associated with Gelson's products, such as high quality, fresh, organic, premium, healthy, upscale, high end feeling, good product, and more. The background is mostly white with orange accents and text.
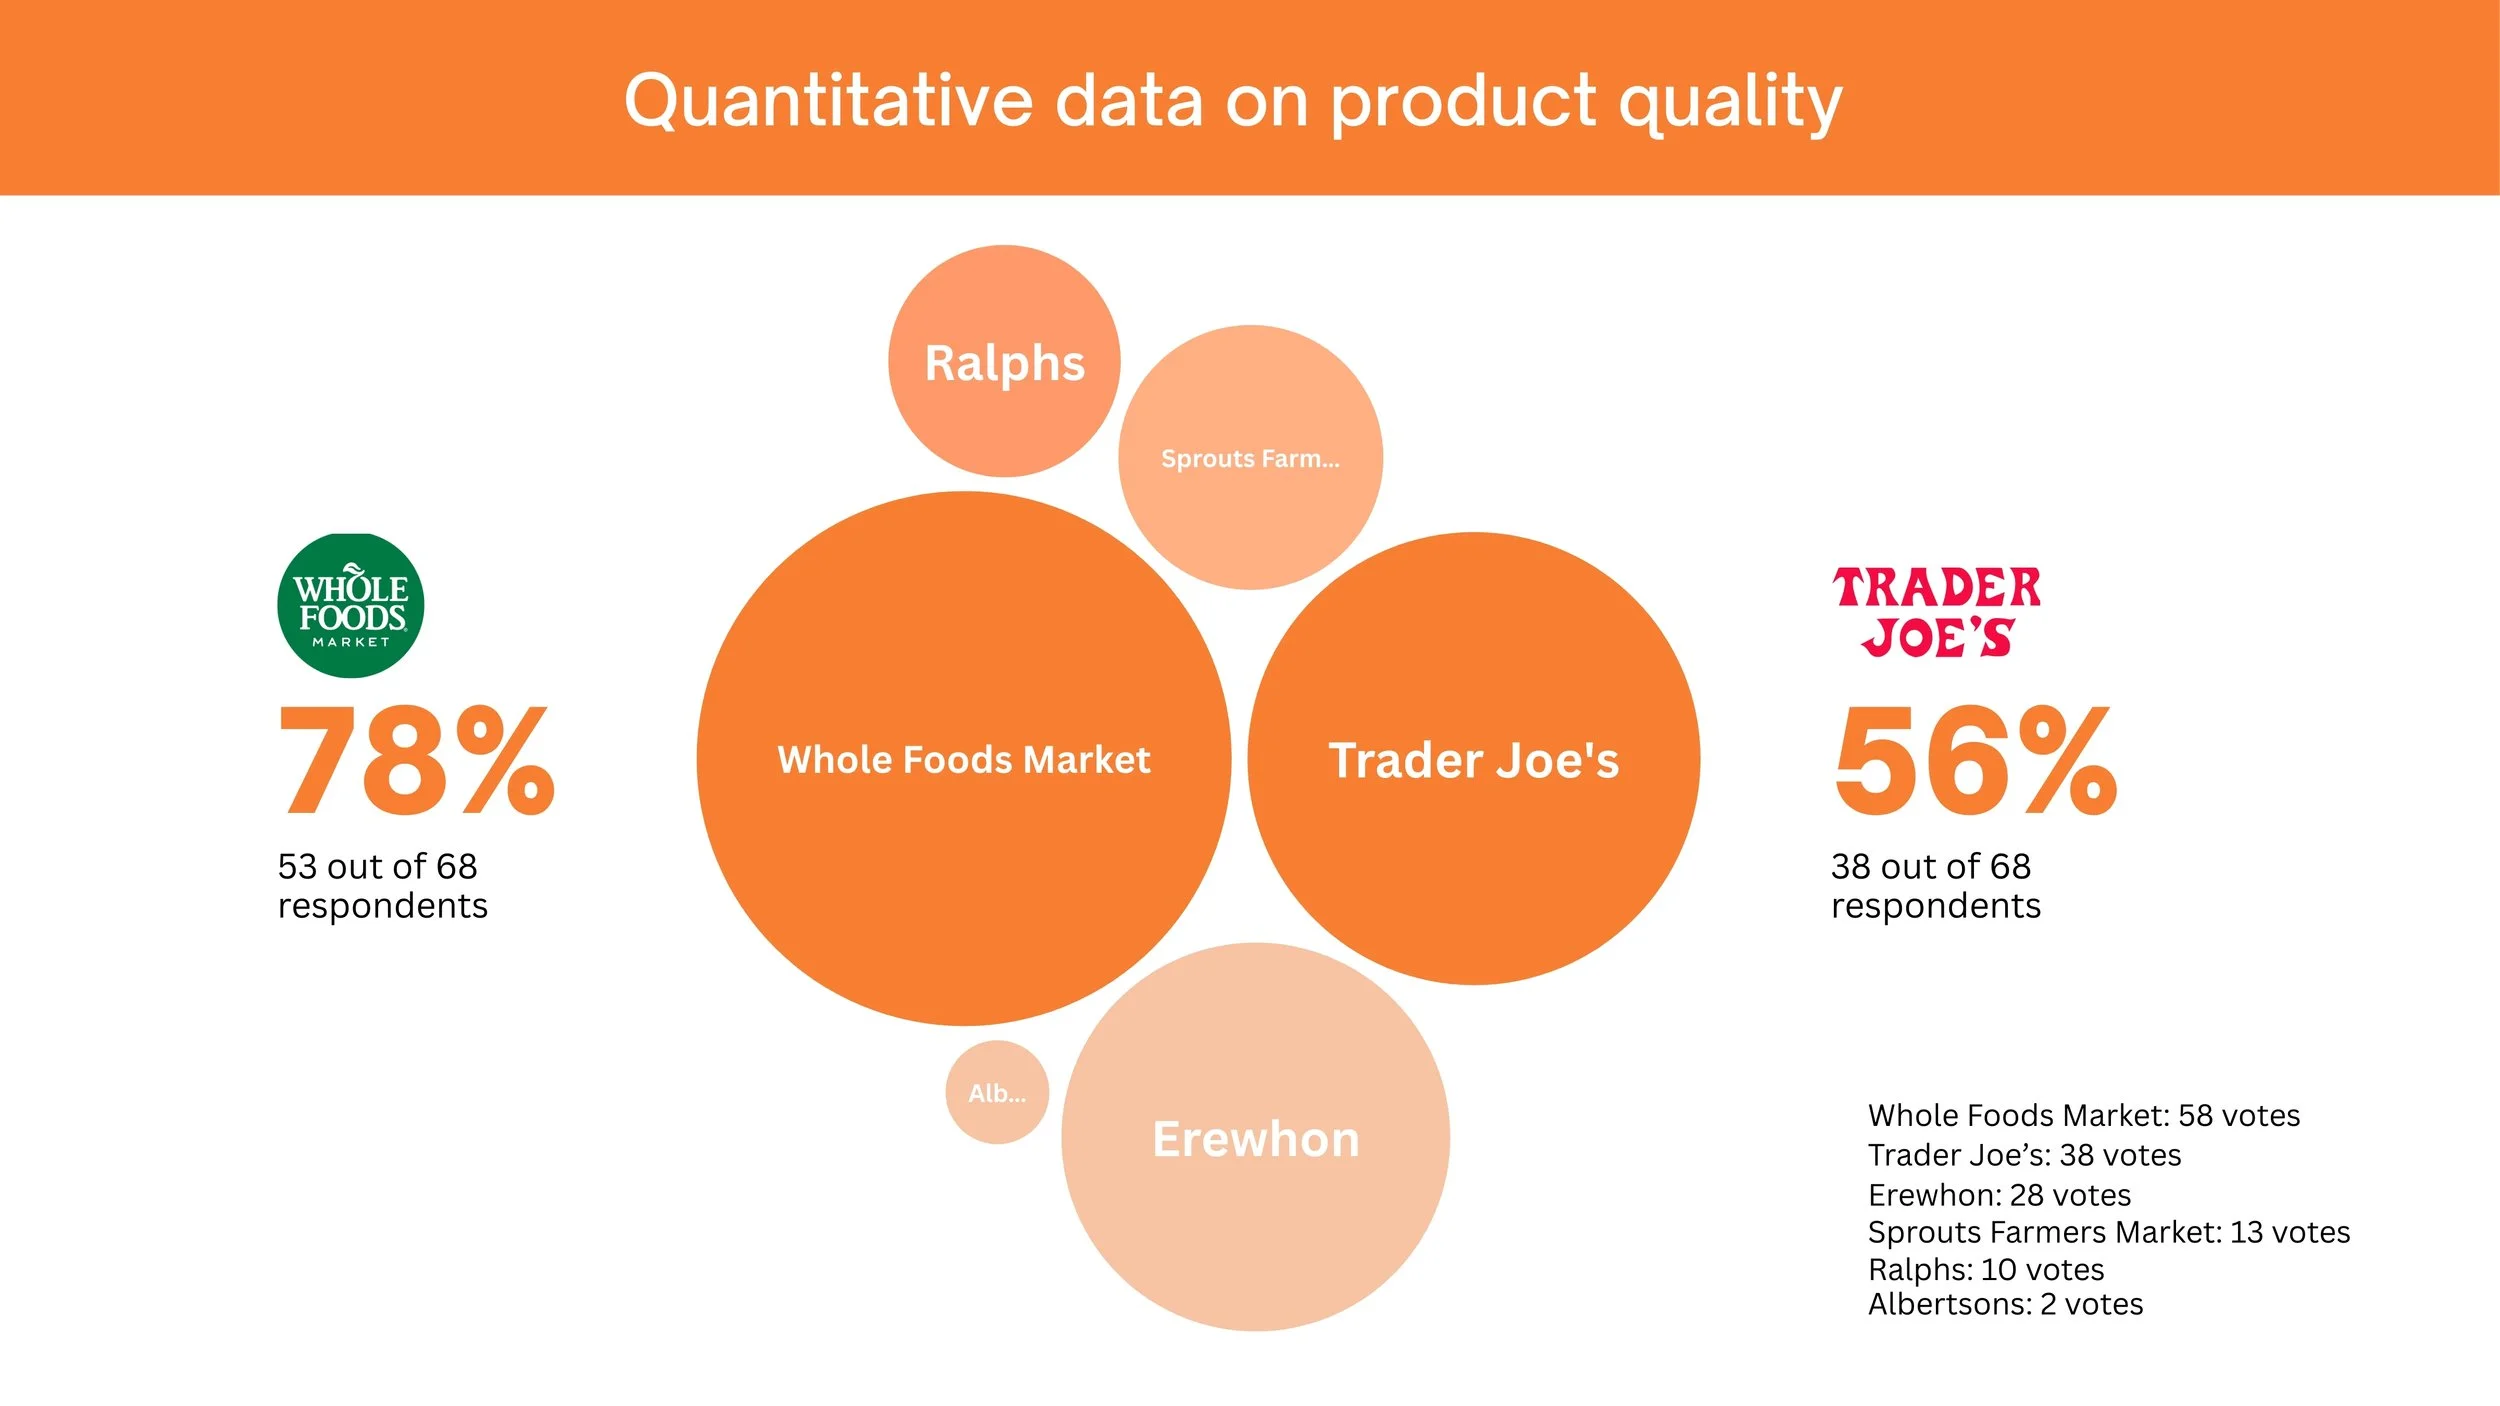
A bubble chart comparing responses about product quality from Whole Foods Market, Trader Joe's, Erewhon, Sprouts Farmers Market, Ralphs, and Albertsons. Whole Foods Market has 78%, Trader Joe's 56%, Erewhon 28%, Sprouts Farmers Market about 13%, Ralphs 10%, and Albertsons 2%. The chart shows the number of responses for each store, with Whole Foods Market having 53 out of 68, Trader Joe's 38 out of 68, and others listed.
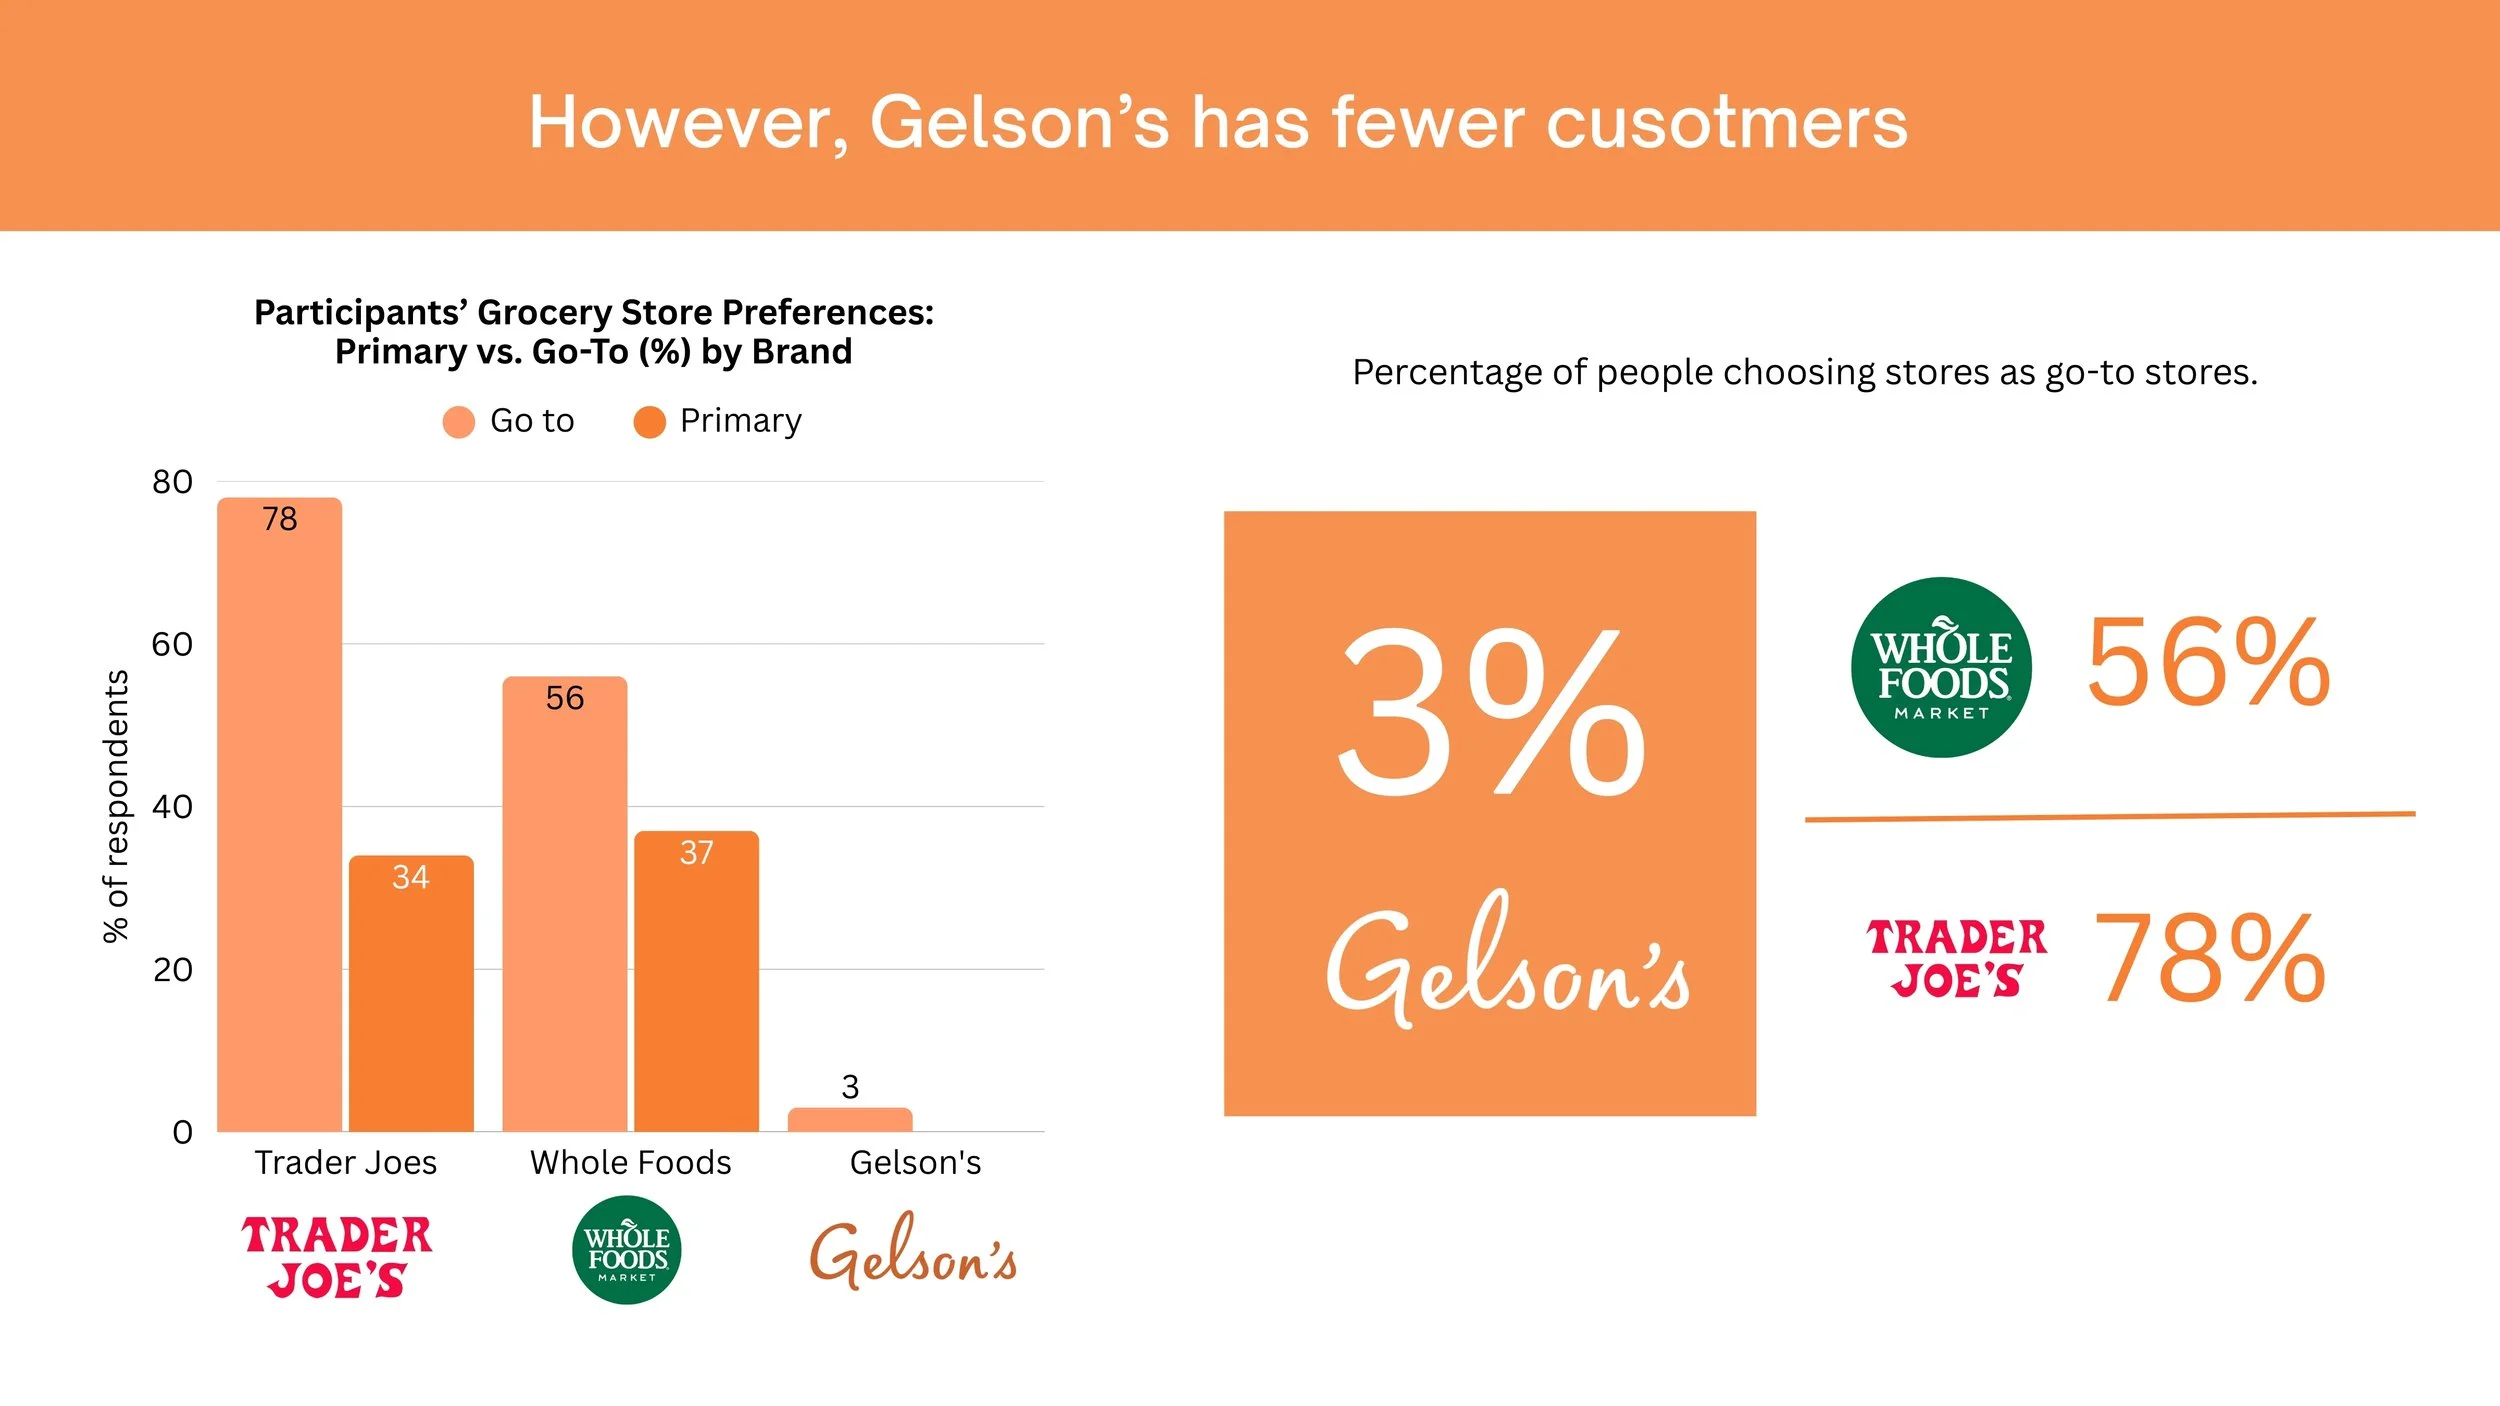
Comparison of grocery store preferences showing Trader Joe's with the highest percentage of 78%, Whole Foods with 56%, and Gelson's with 3%, along with a percentage of 56% for Whole Foods, 3% for Gelson's, 78% for Trader Joe's, and a statement that Gelson's has fewer customers.
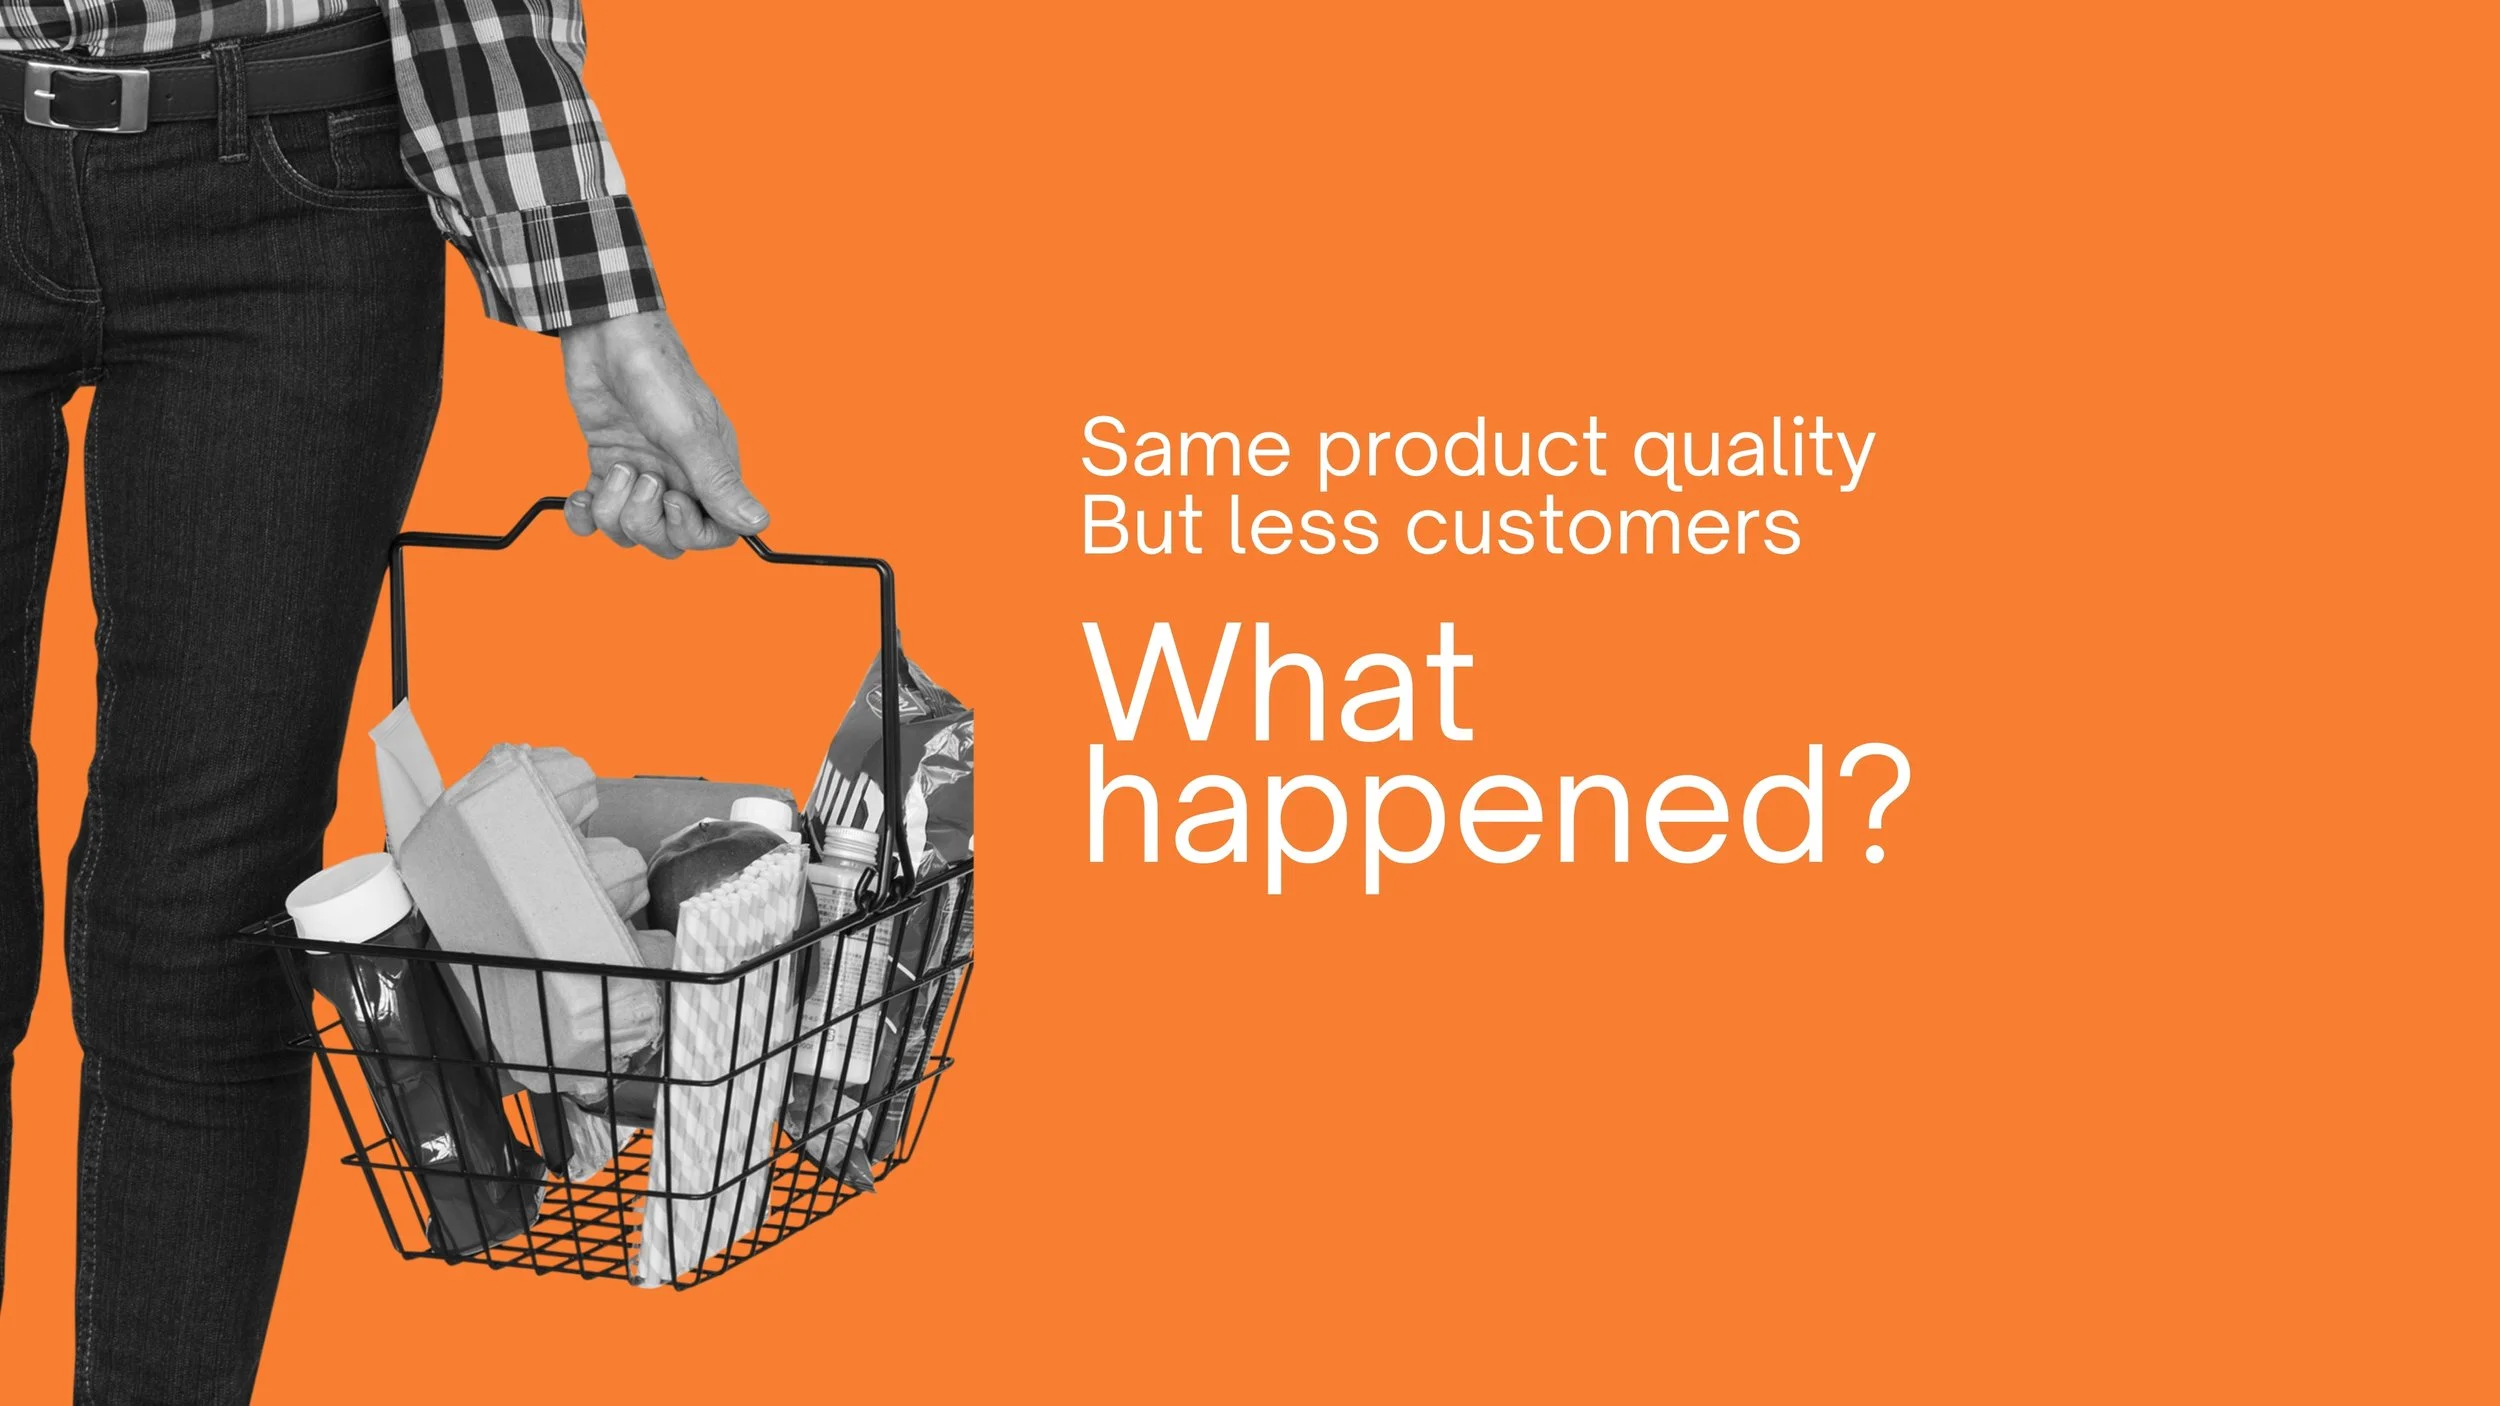
Part of a person dressed in black jeans and a checkered shirt, holding a shopping basket filled with groceries, against an orange background with white text that reads, "Same product quality but less customers. What happened?".
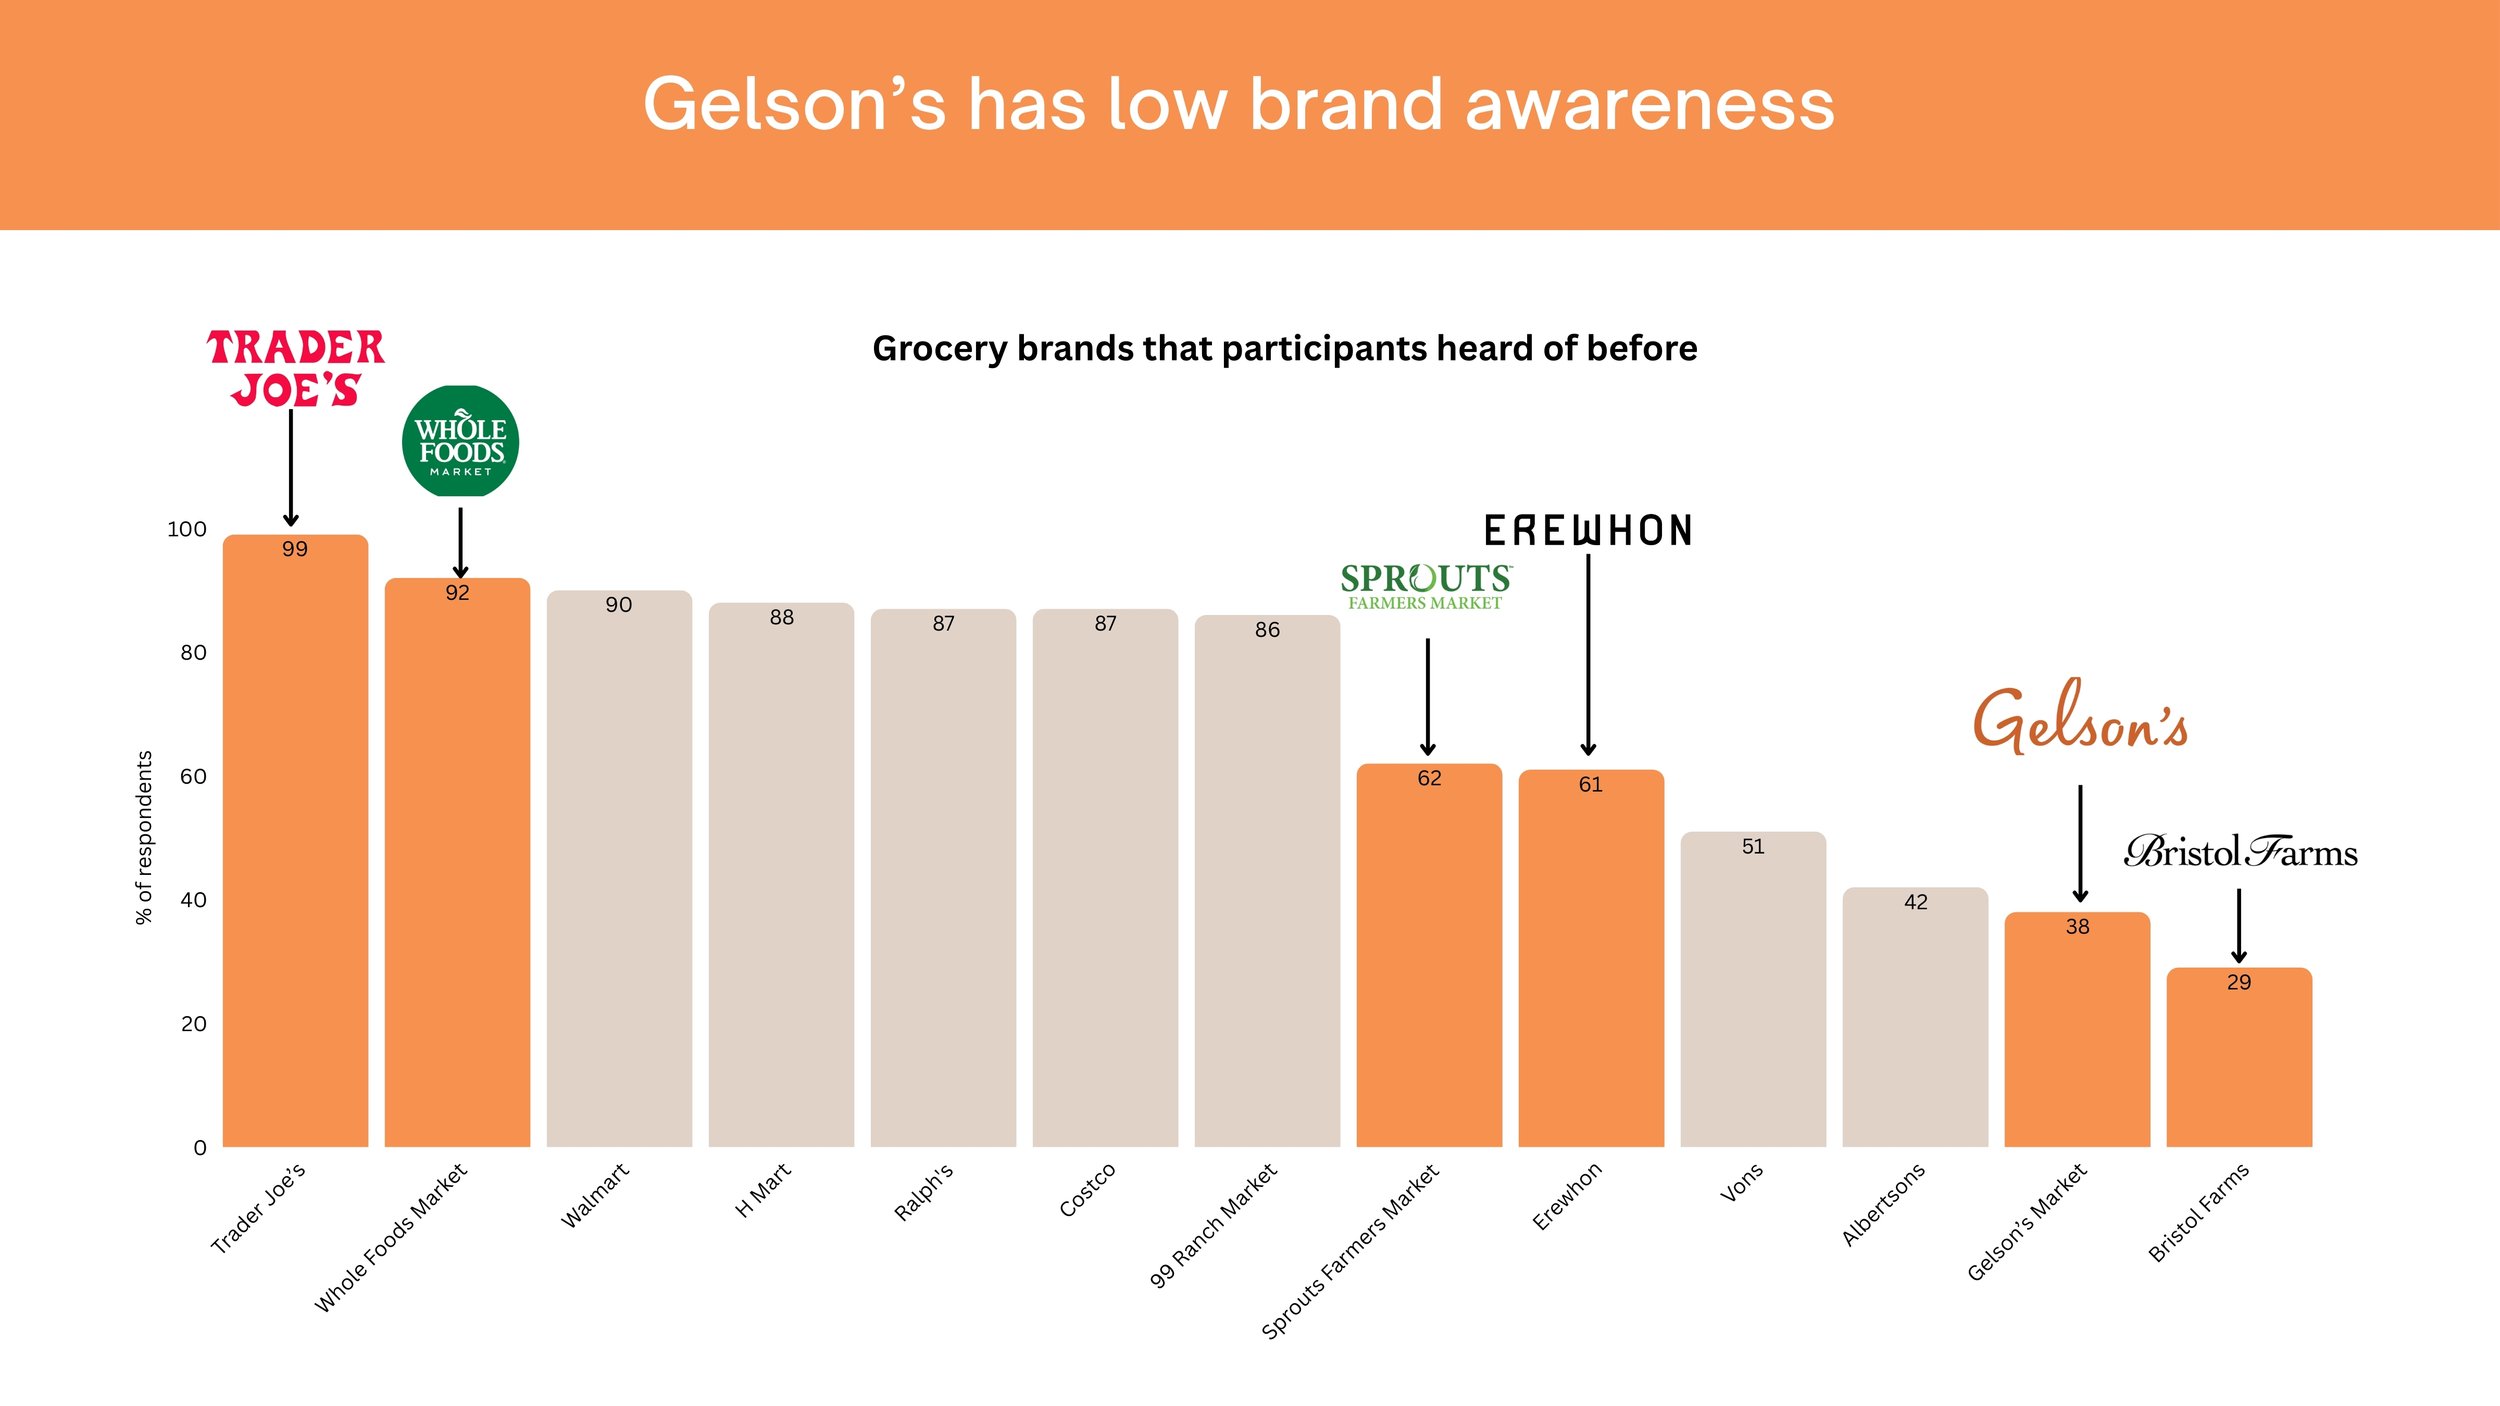
Bar chart showing percentage of respondents familiar with grocery brands before, with Trader Joe's at 99%, Whole Foods Market at 92%, and Gelson's at 38%, indicating low brand awareness for Gelson's.
Comparison chart showing brand perceptions for Trader Joe's, Gelson's, and Whole Foods Market. Each brand's funnel chart displays percentages for criteria: heard of, high quality, high product variety, and good value for price.
A hand holding a megaphone against an orange background with white text that reads, "How to Improve Brand Awareness and Brand Perception?"
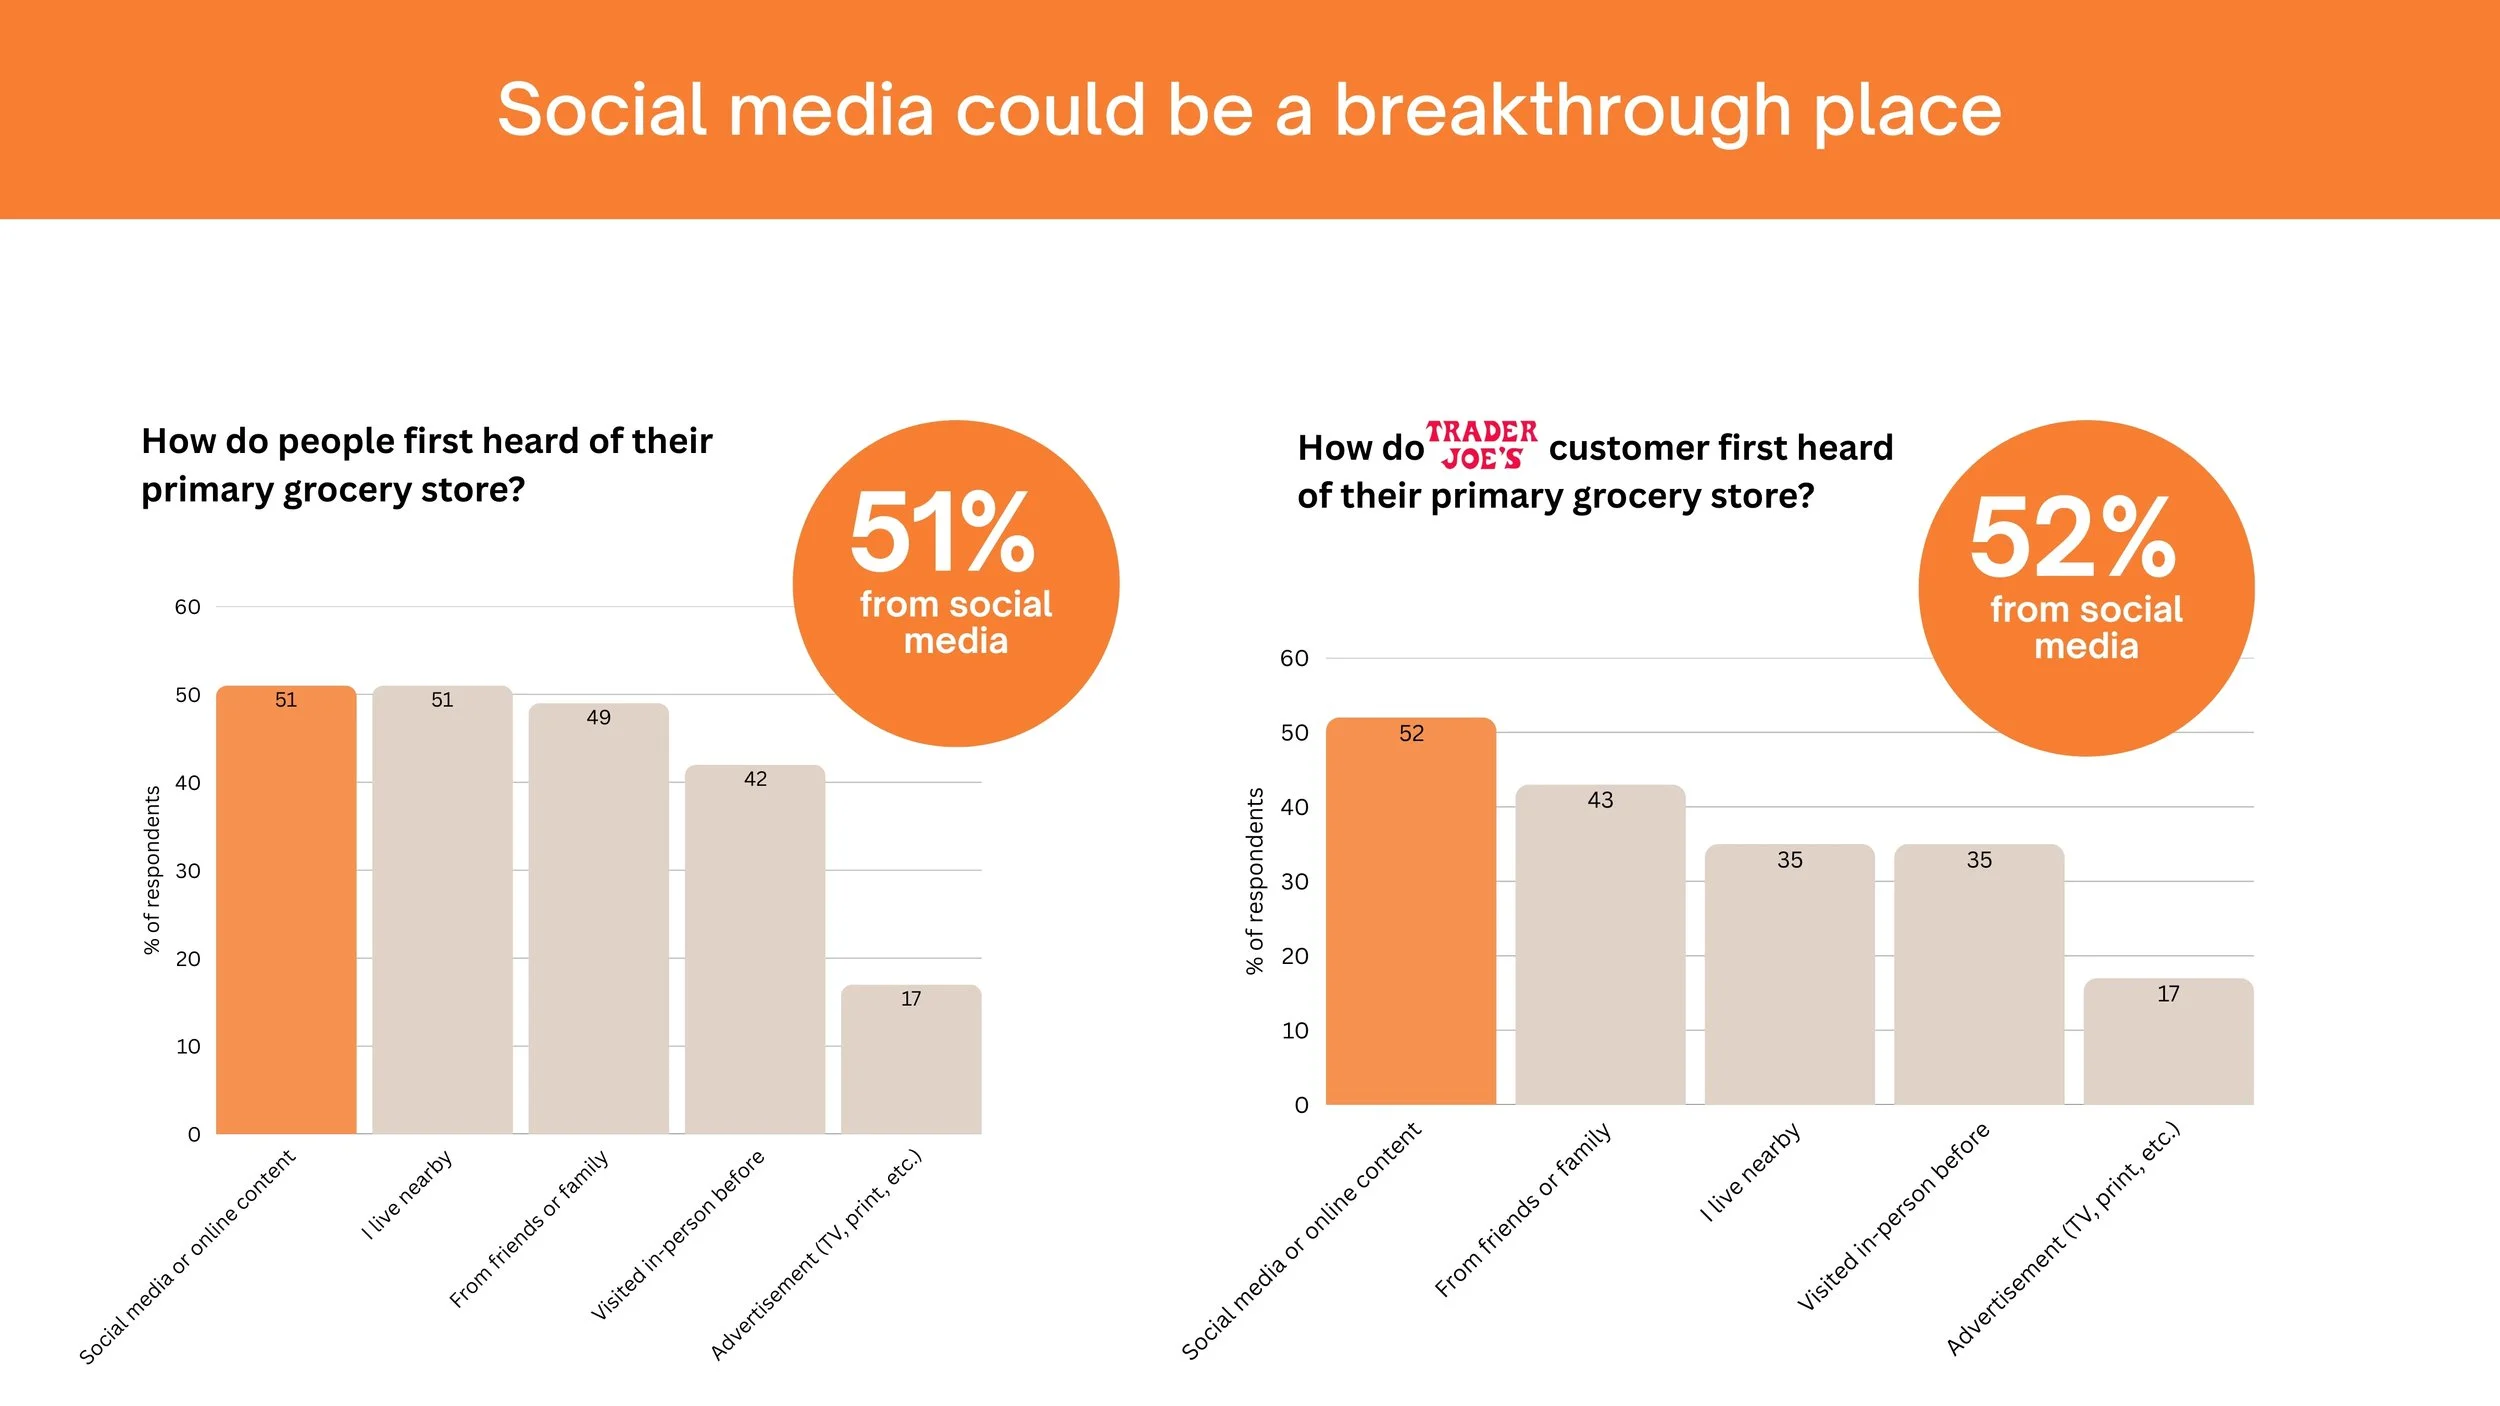
Comparative bar chart showing survey responses about how people hear of their primary grocery store from social media. The left side shows responses for the first store, with 51% citing online content and 51% hearing from social media. The right side shows responses for a different store, Trader Joe's, with 52% citing online content and 43% hearing from social media.
Image of a colorful infographic with the headline 'Social media could be a breakthrough place' and three illustrated women with quotes discussing social media and daily life, accompanied by small icons and text snippets.
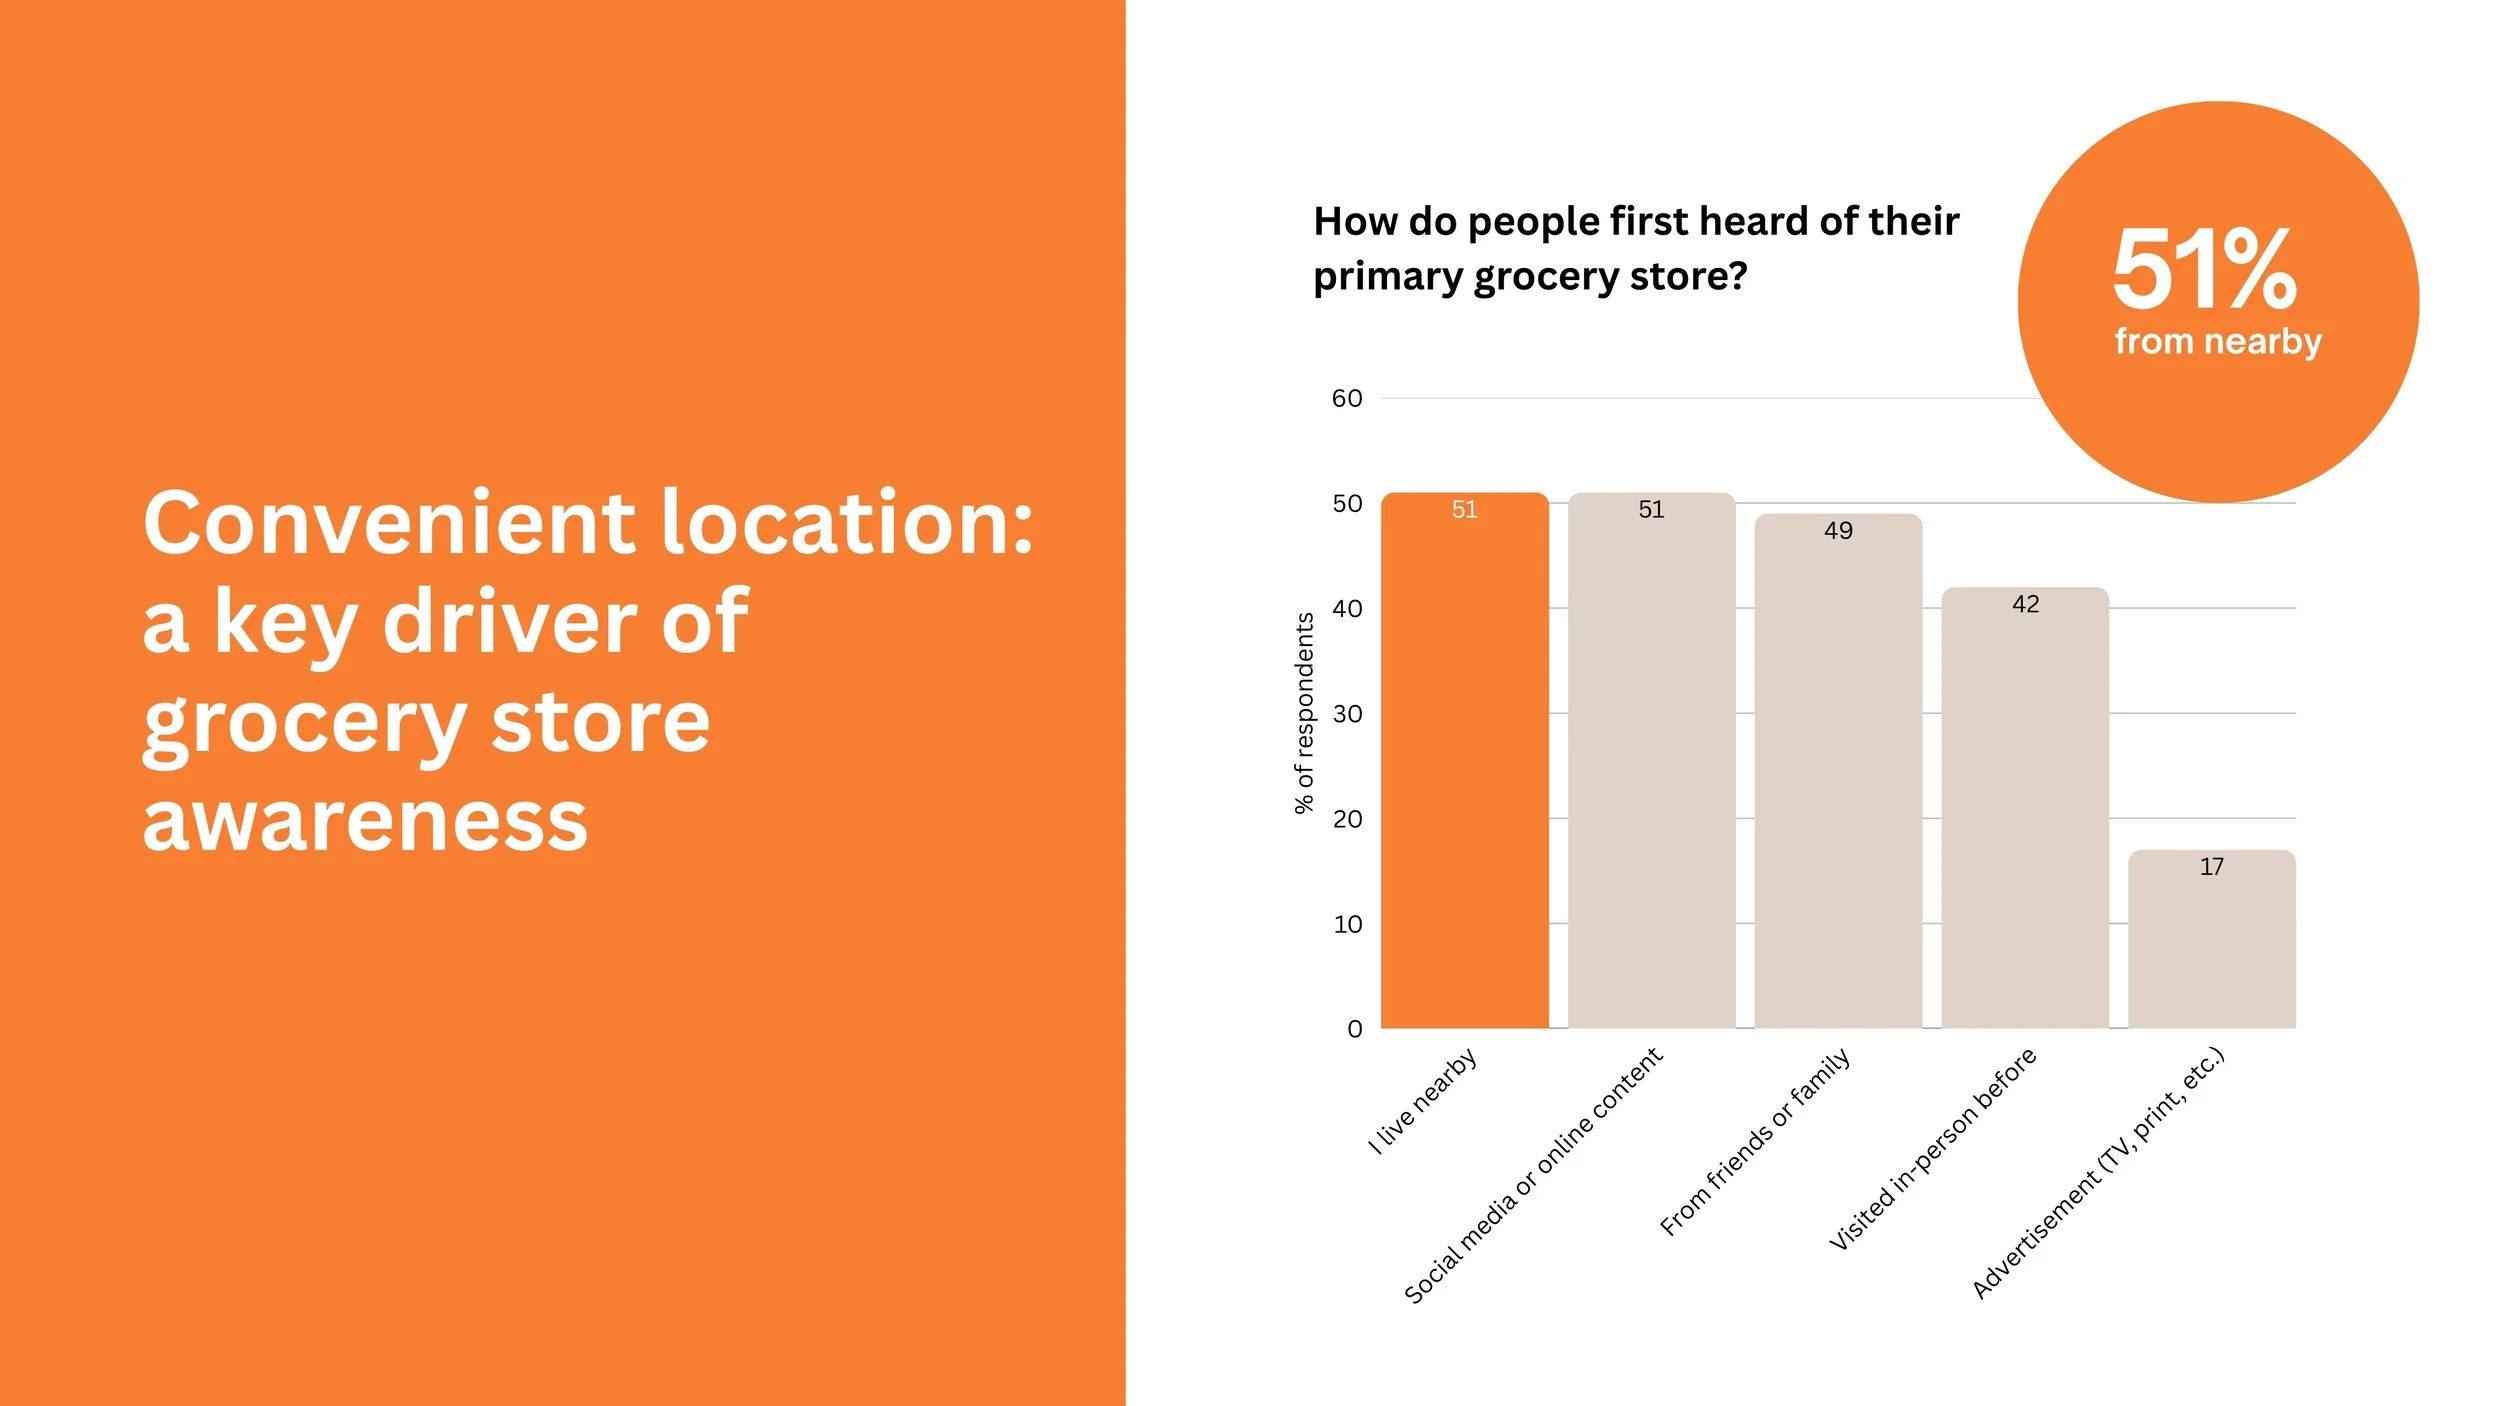
A slide from a presentation showing a bar graph about how people first heard of their primary grocery store, highlighting that 51% heard from nearby, with the rest from online content, friends, or other sources. The slide has an orange background with white bold text stating, 'Convenient location: a key driver of grocery store awareness'.
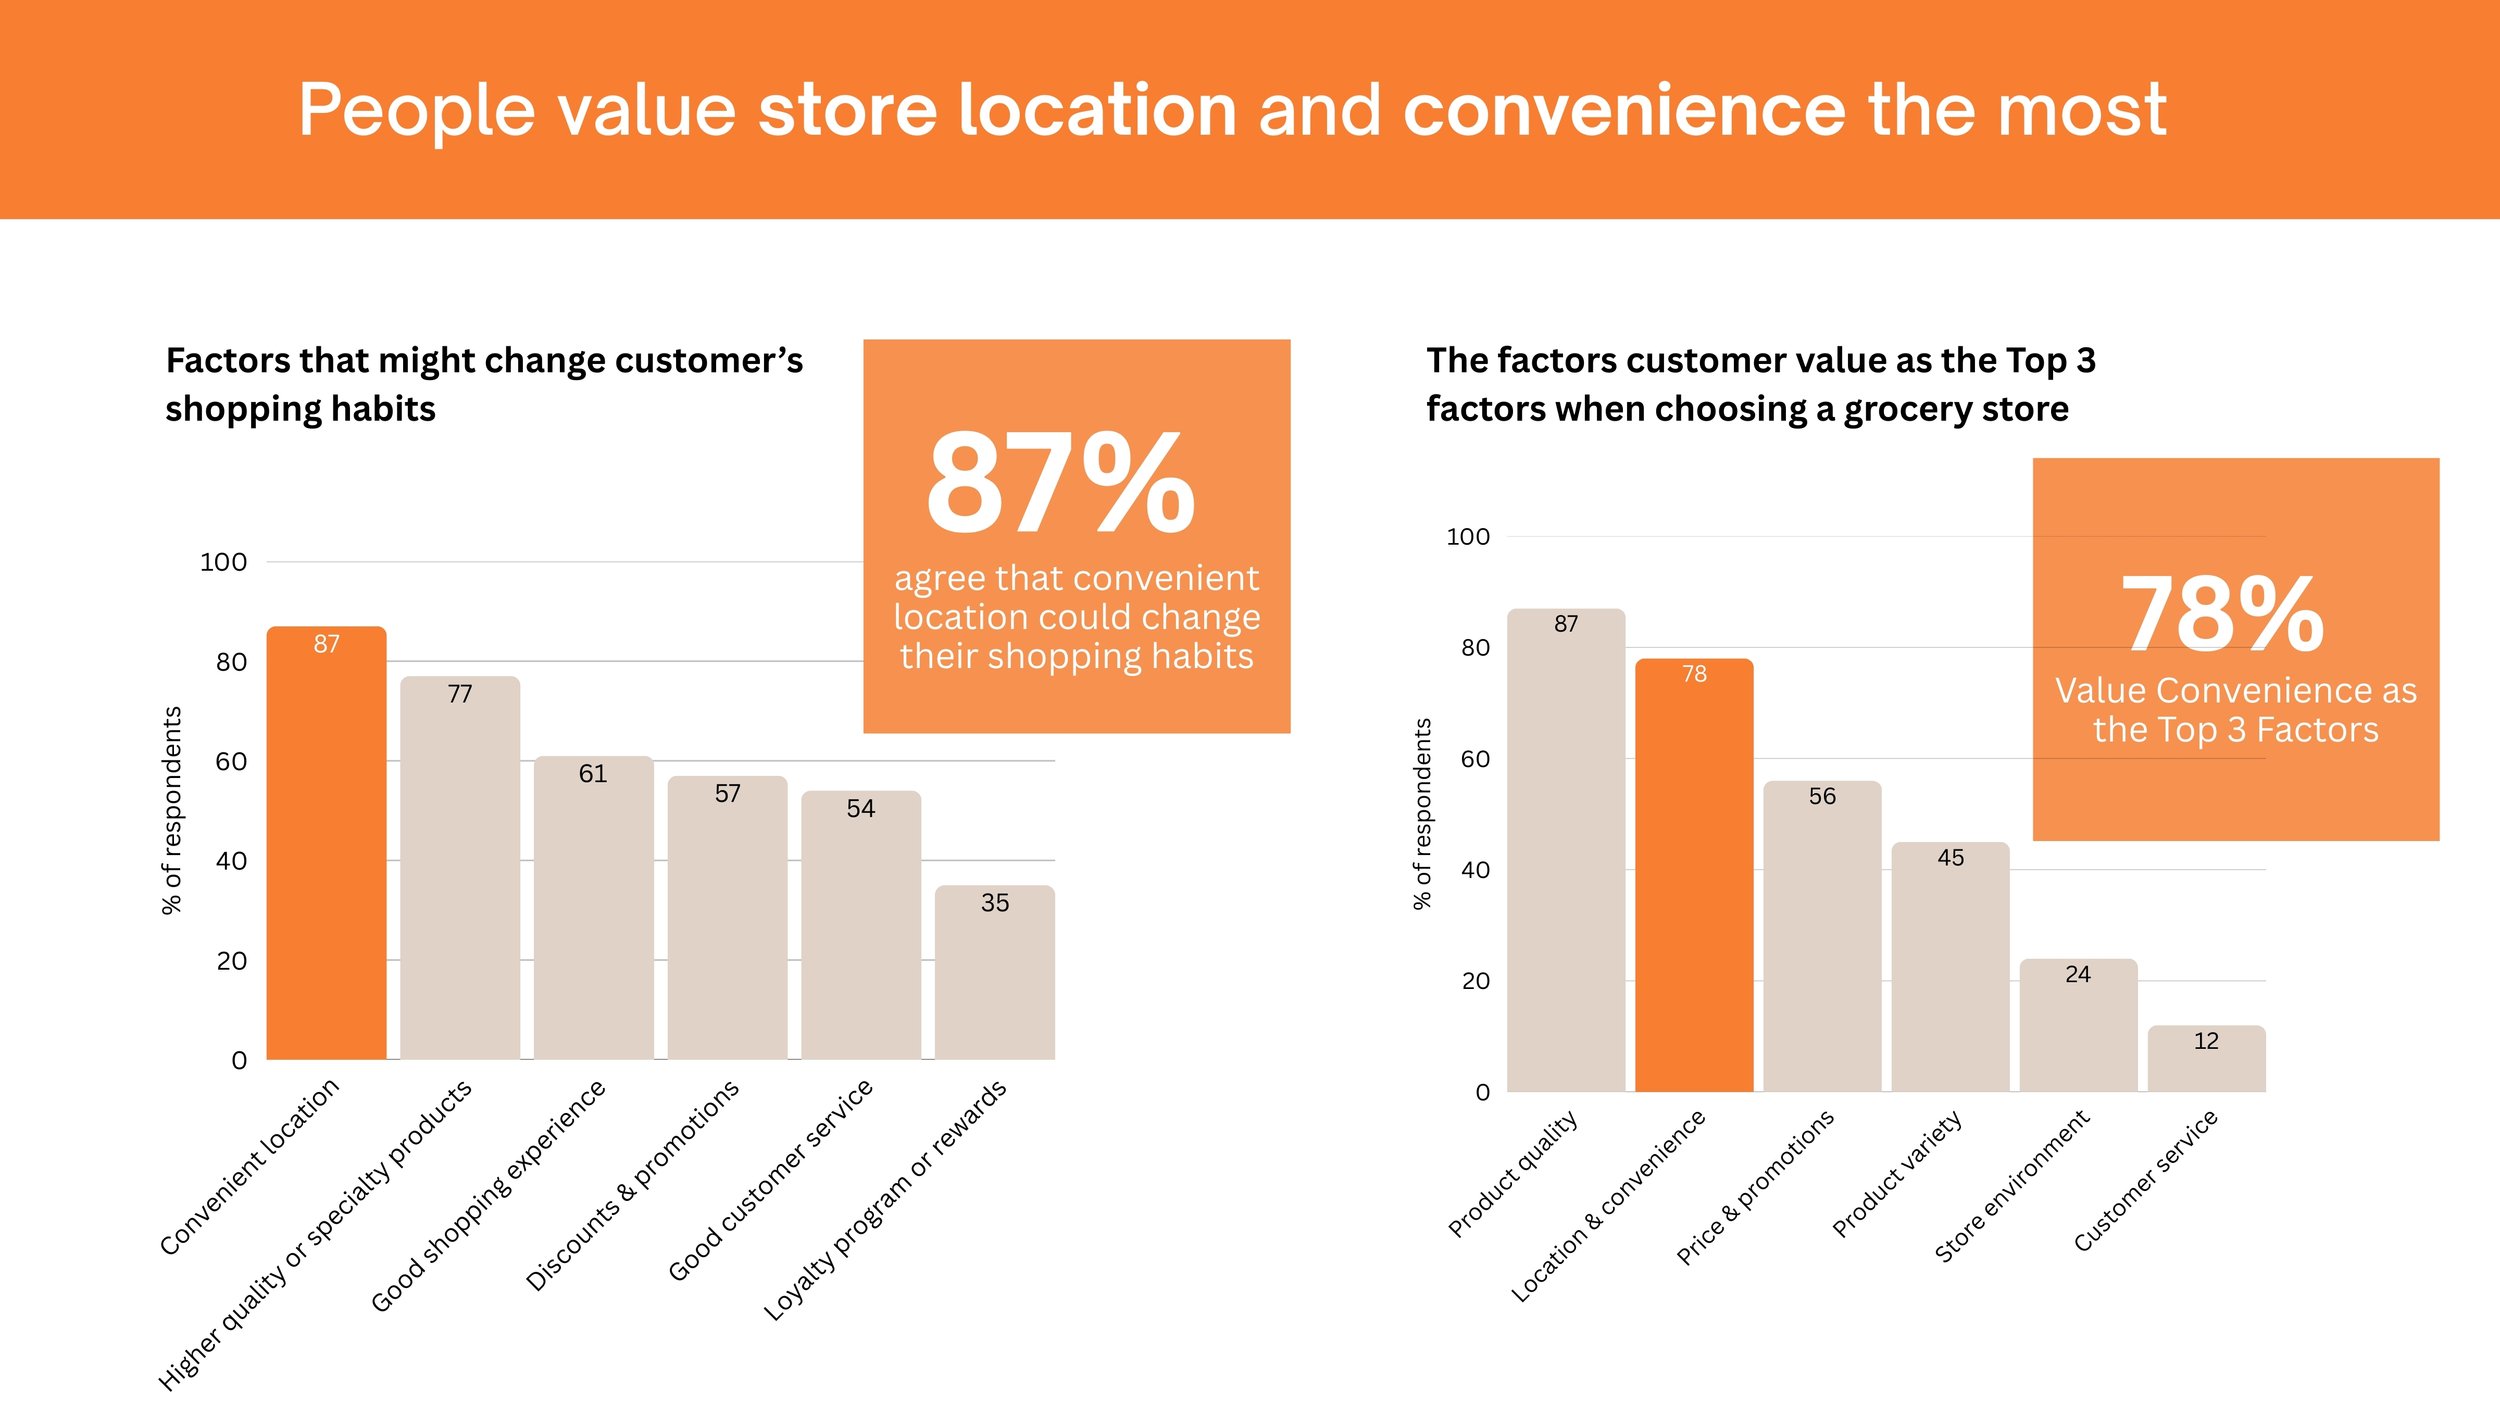
A bar chart comparing factors influencing customer shopping habits and grocery store choice, highlighting convenience and value as top factors.
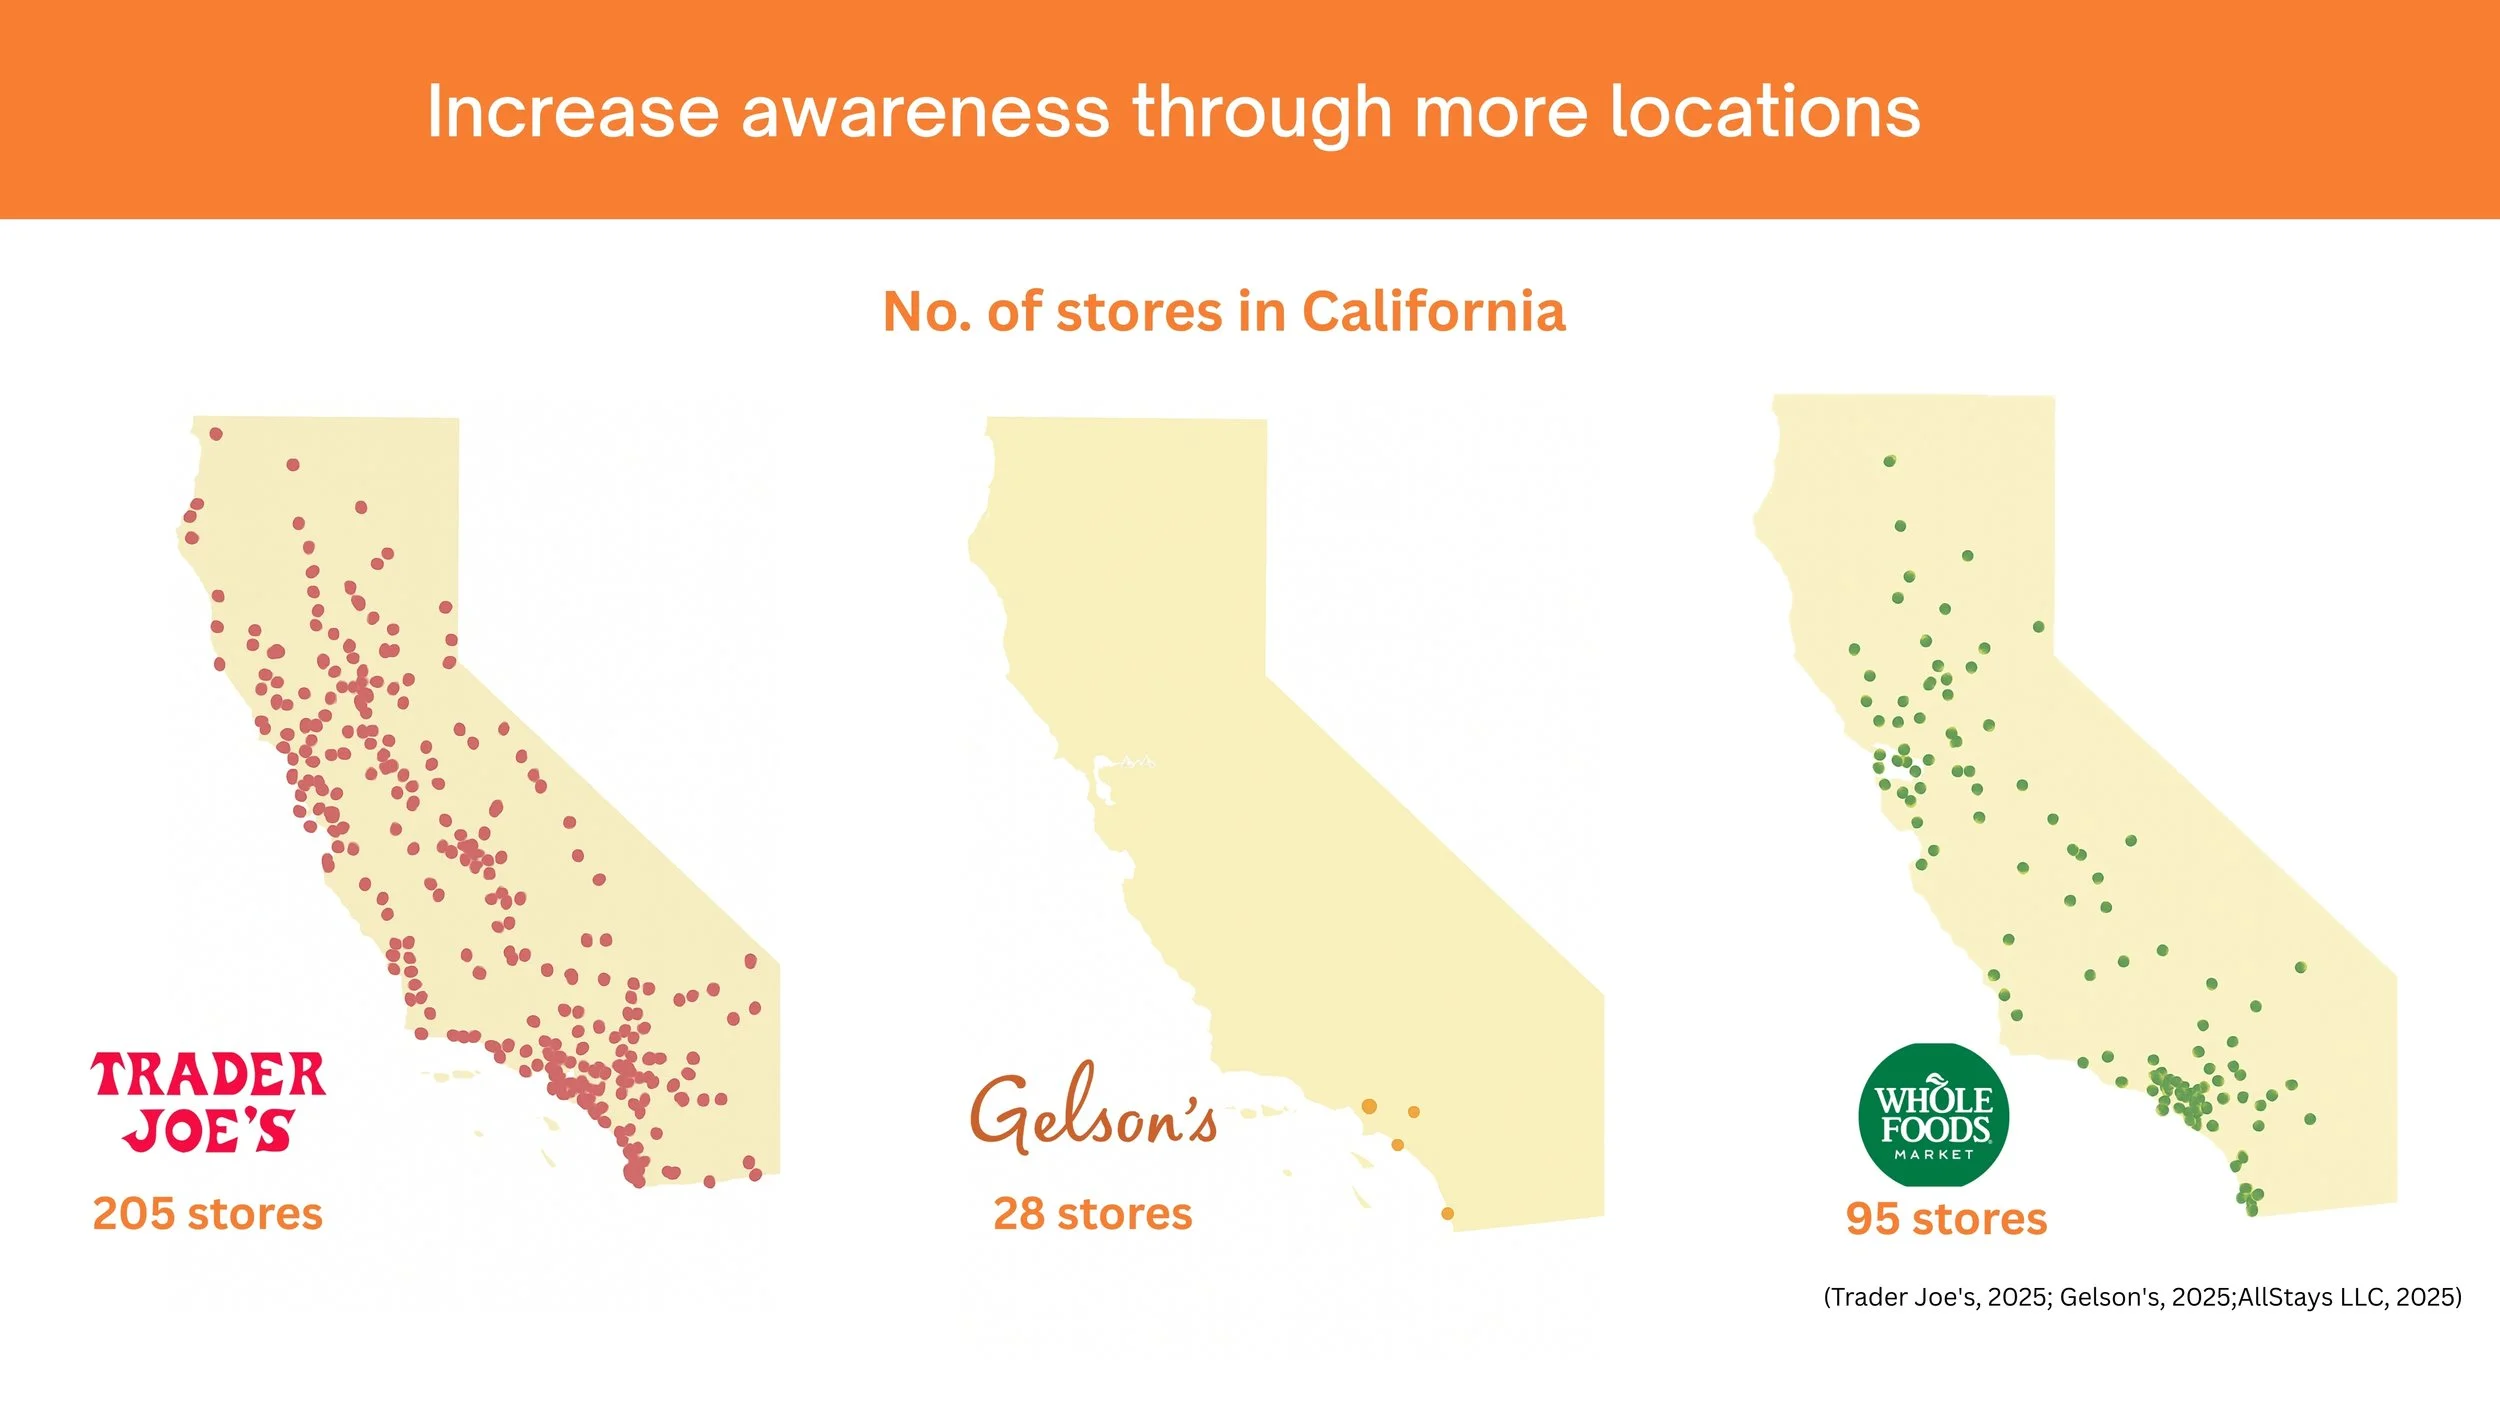
Map of California showing the number of stores for Trader Joe's, Gelson's, and Whole Foods Market, with 205 Trader Joe's stores marked with red dots, 28 Gelson's stores with orange dots, and 95 Whole Foods stores with green dots.
A shopping cart filled with various grocery items against an orange background, with white text that reads 'How could Gelson's improve specifically?'.
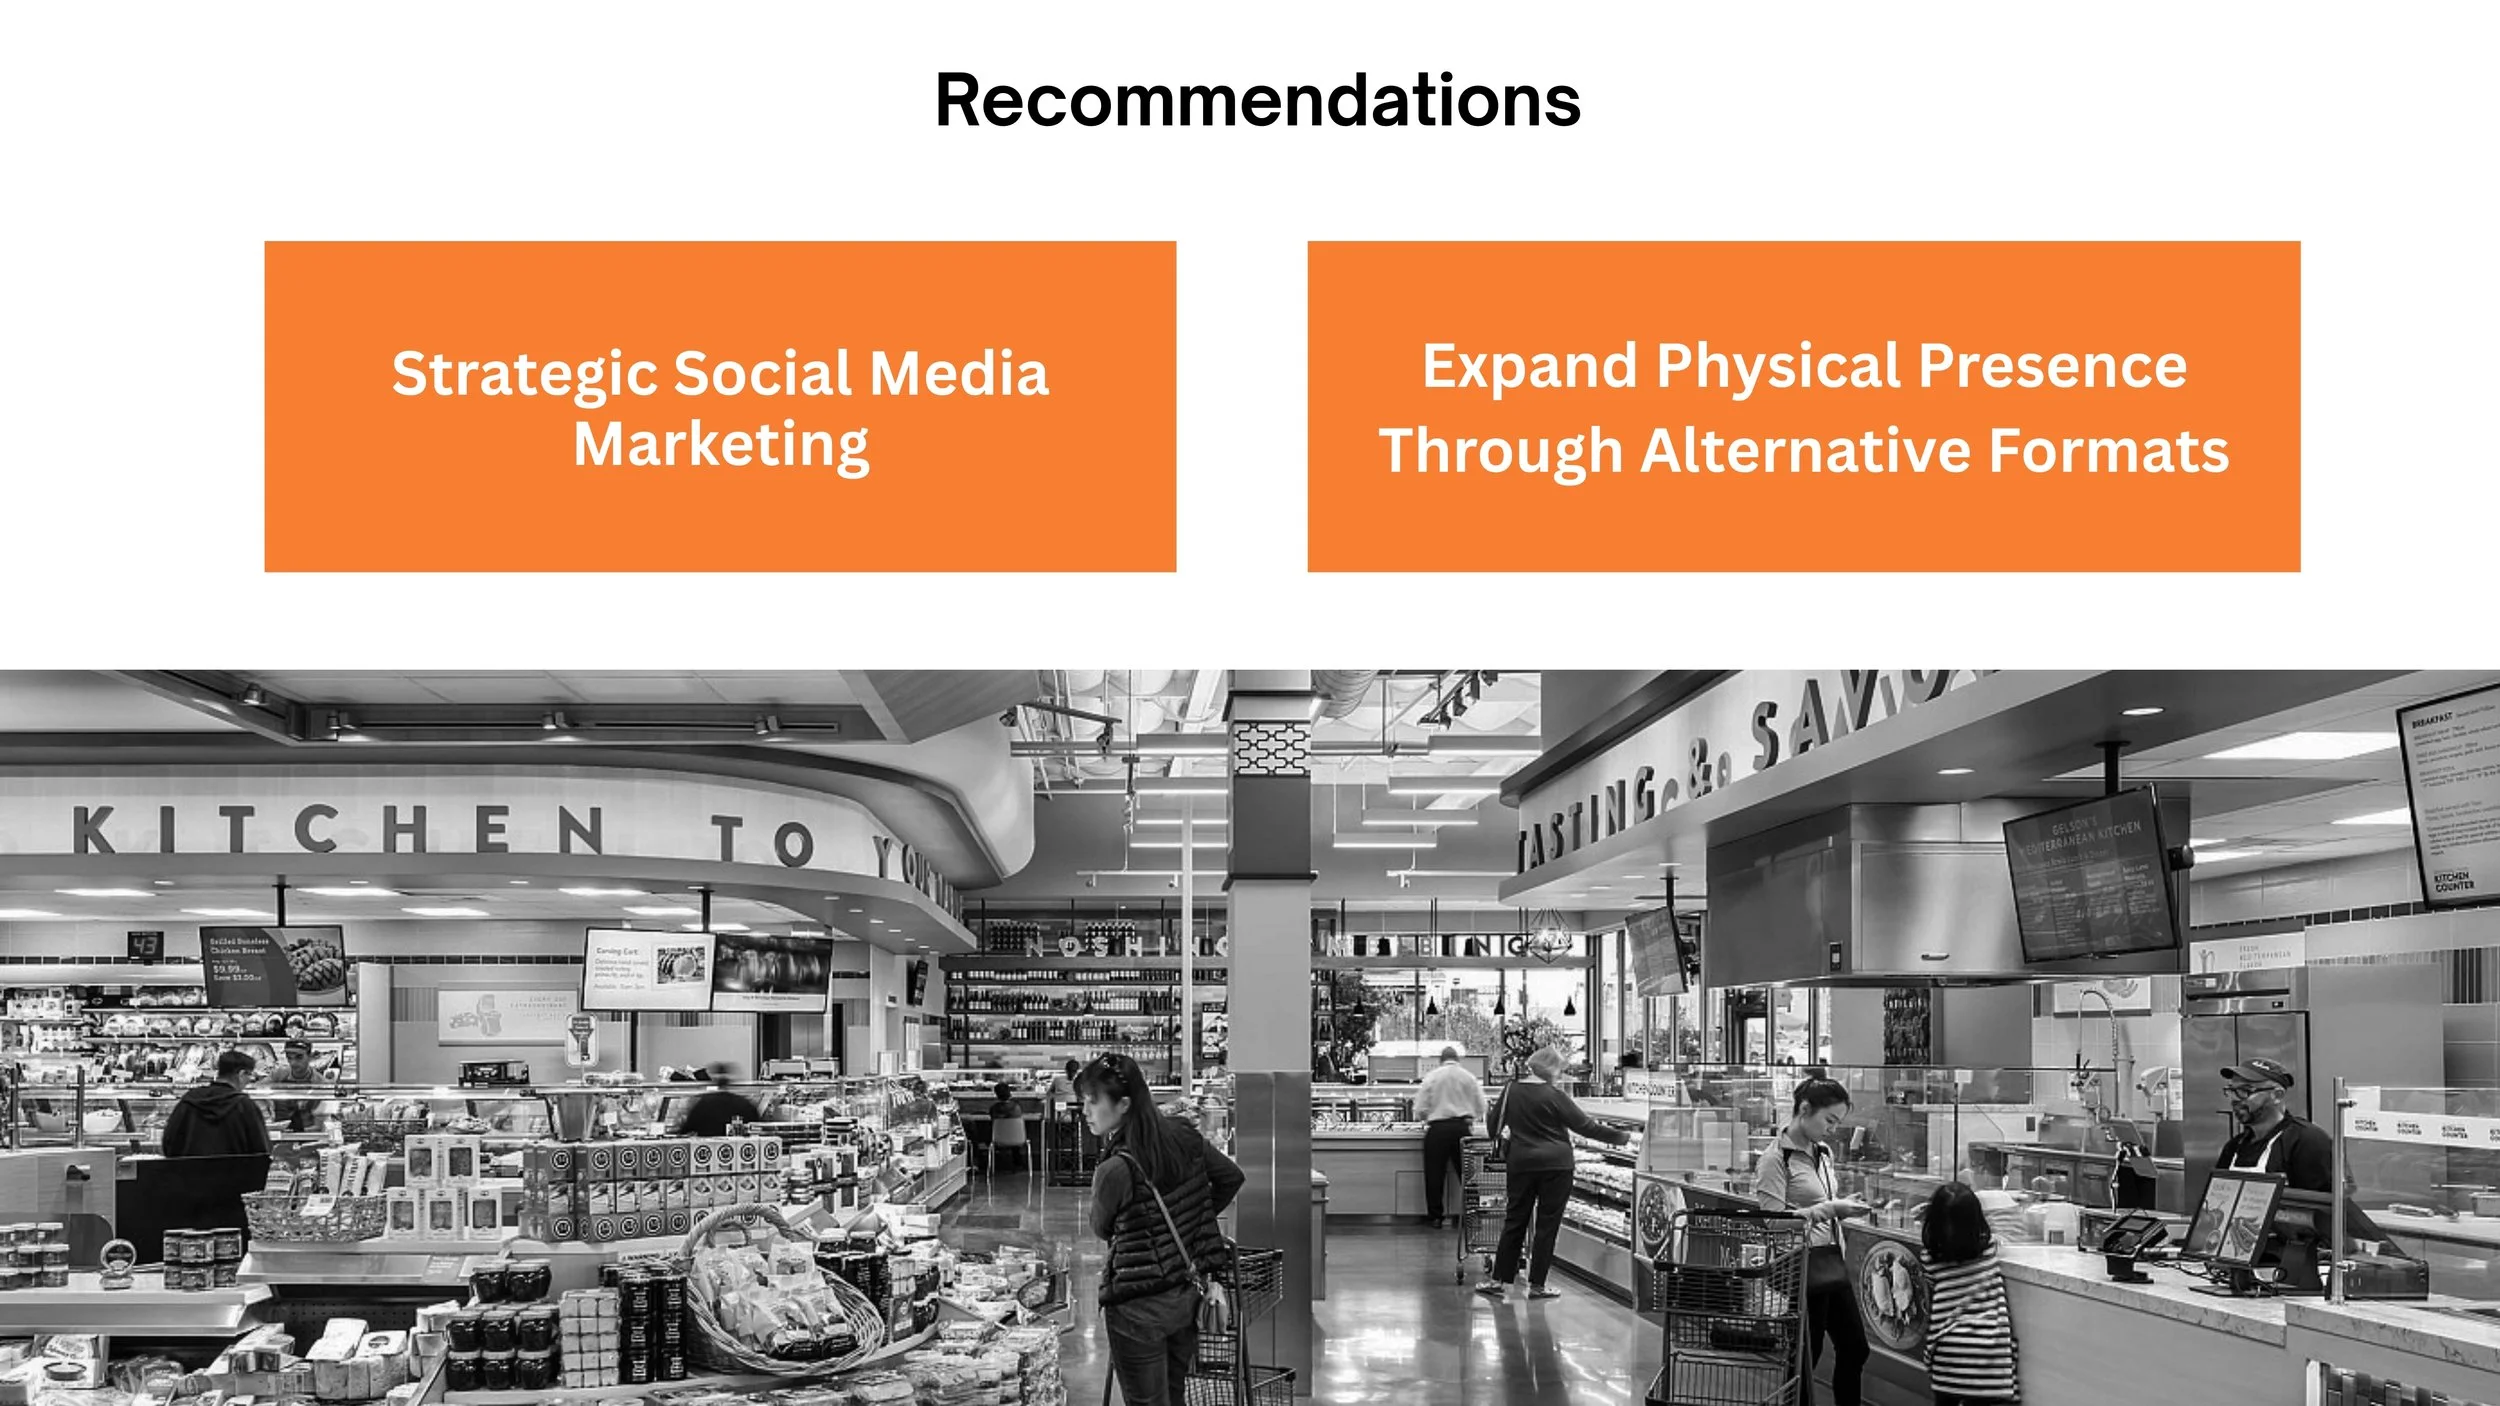
A grocery store with customers shopping at checkout counters, shelves stocked with items, and signs like 'KITCHEN TO YOUR TABLE' and digital screens displaying menu items.
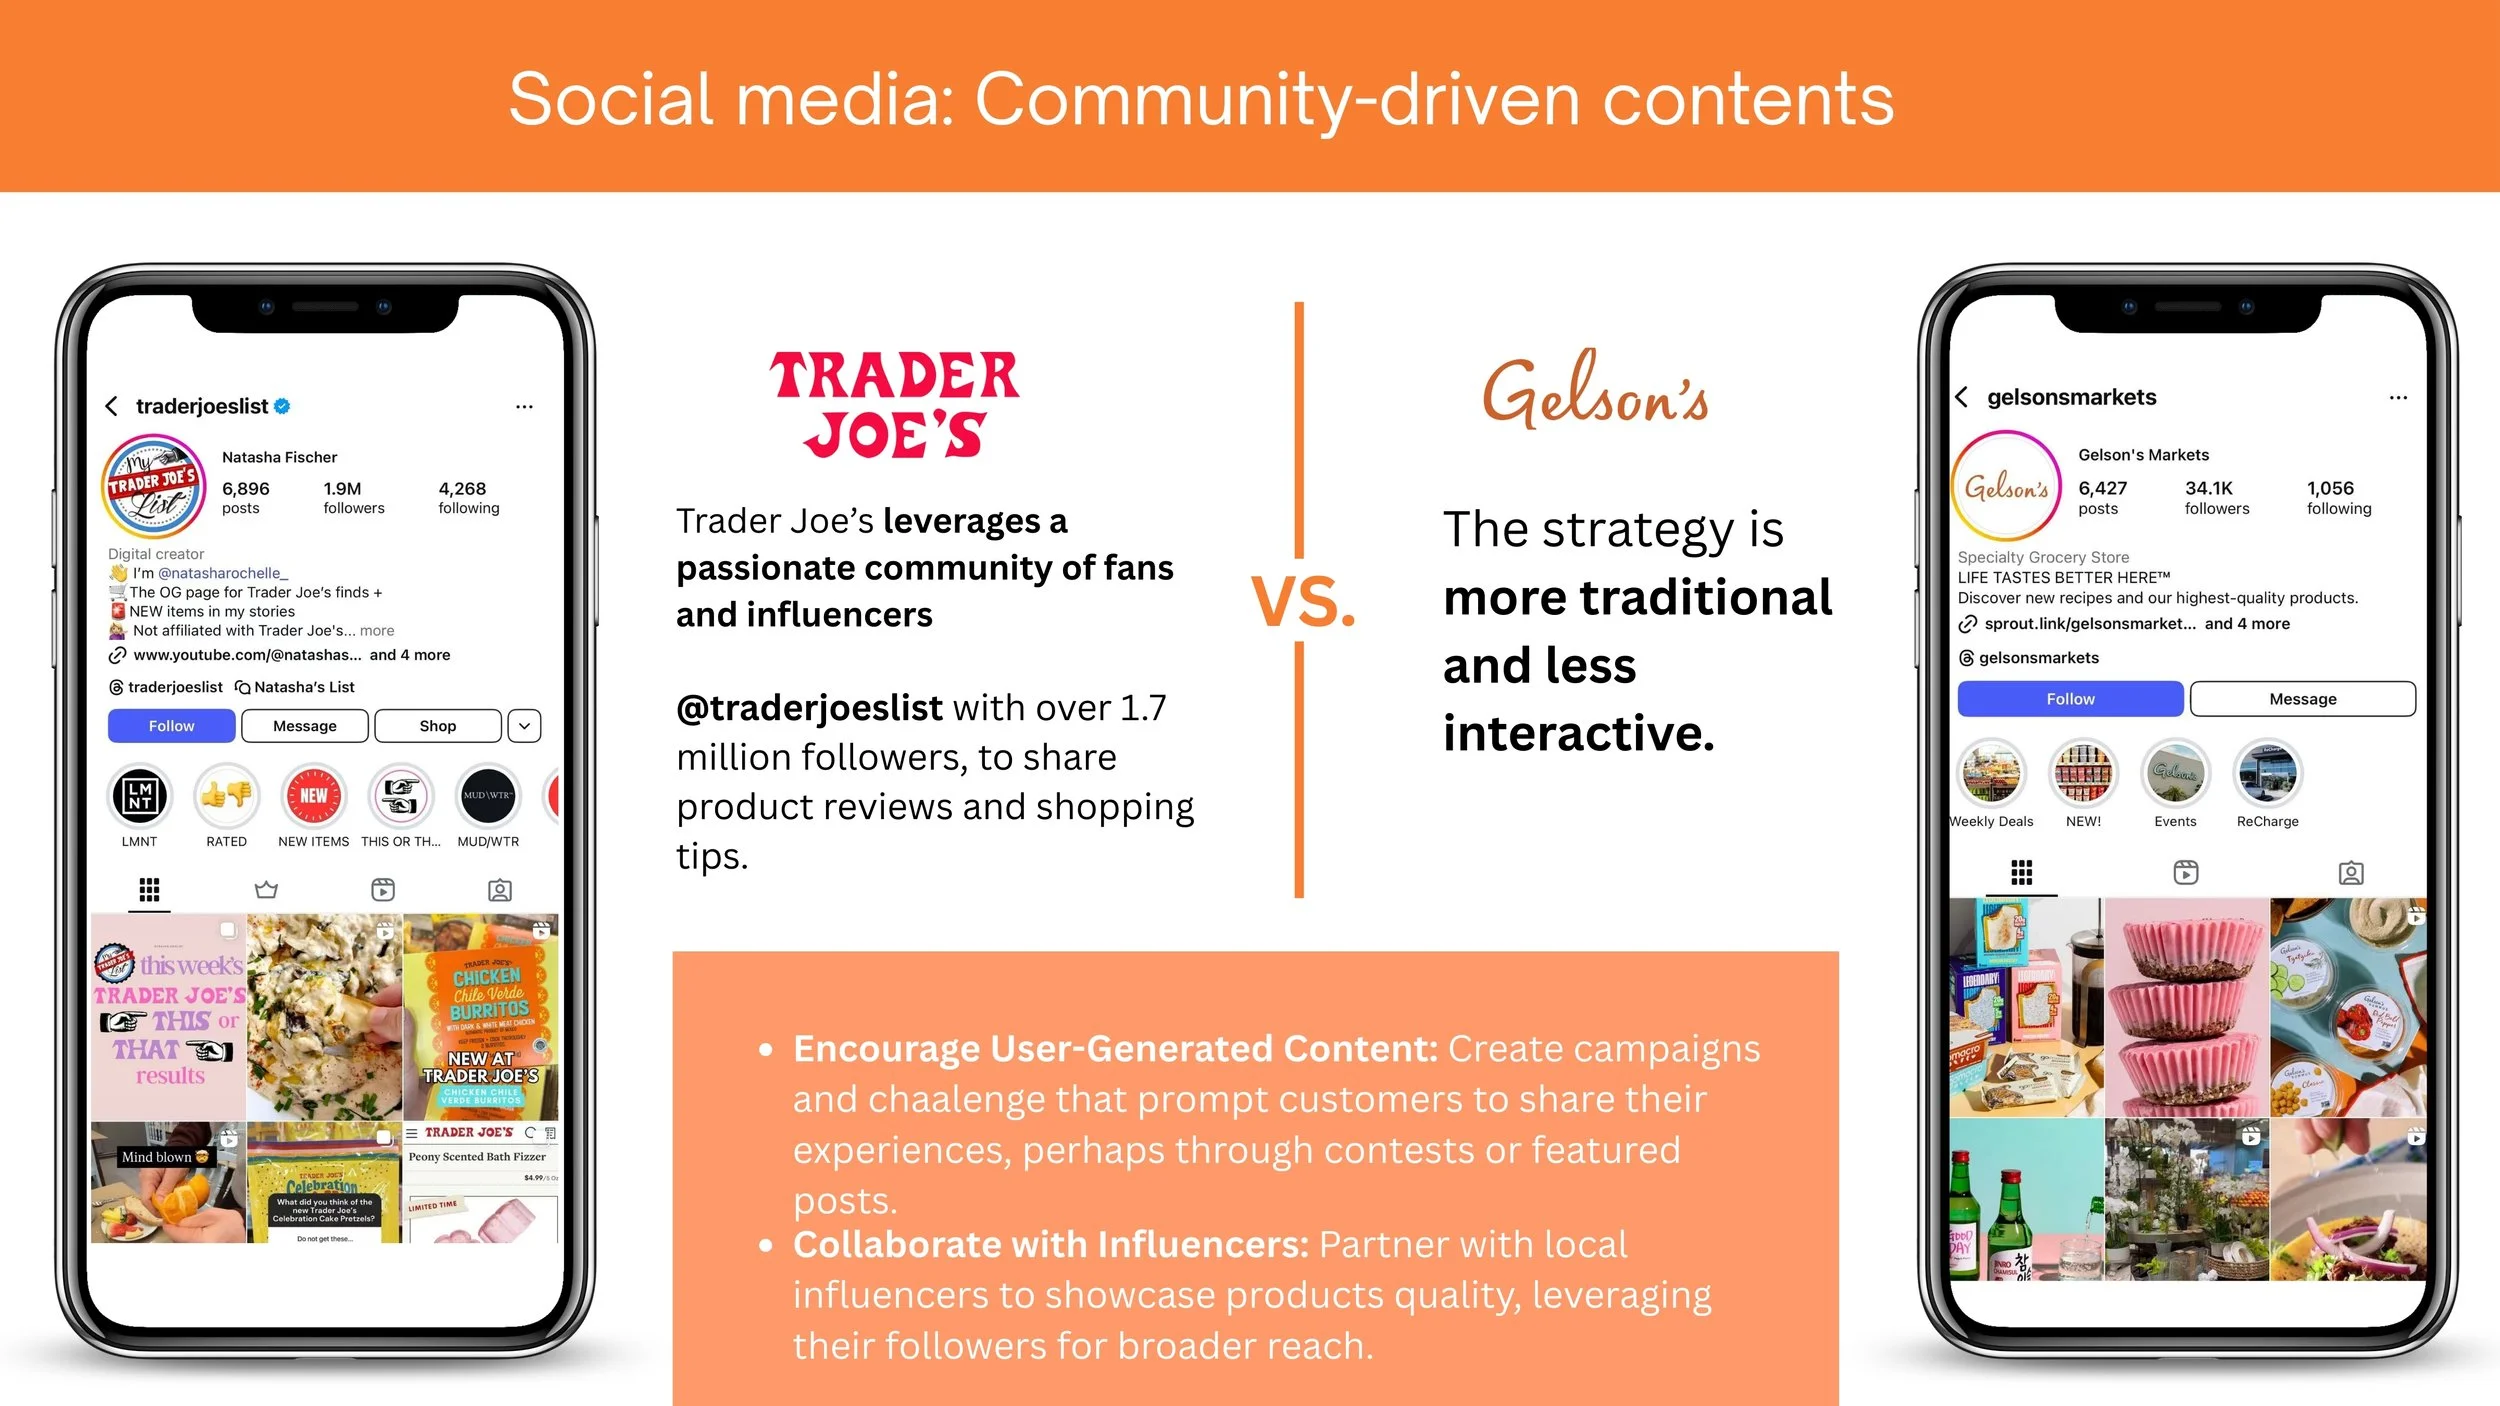
Comparison of social media strategies between Trader Joe's and Gelson's stores, featuring their Instagram profiles on smartphones with follower statistics and content examples.
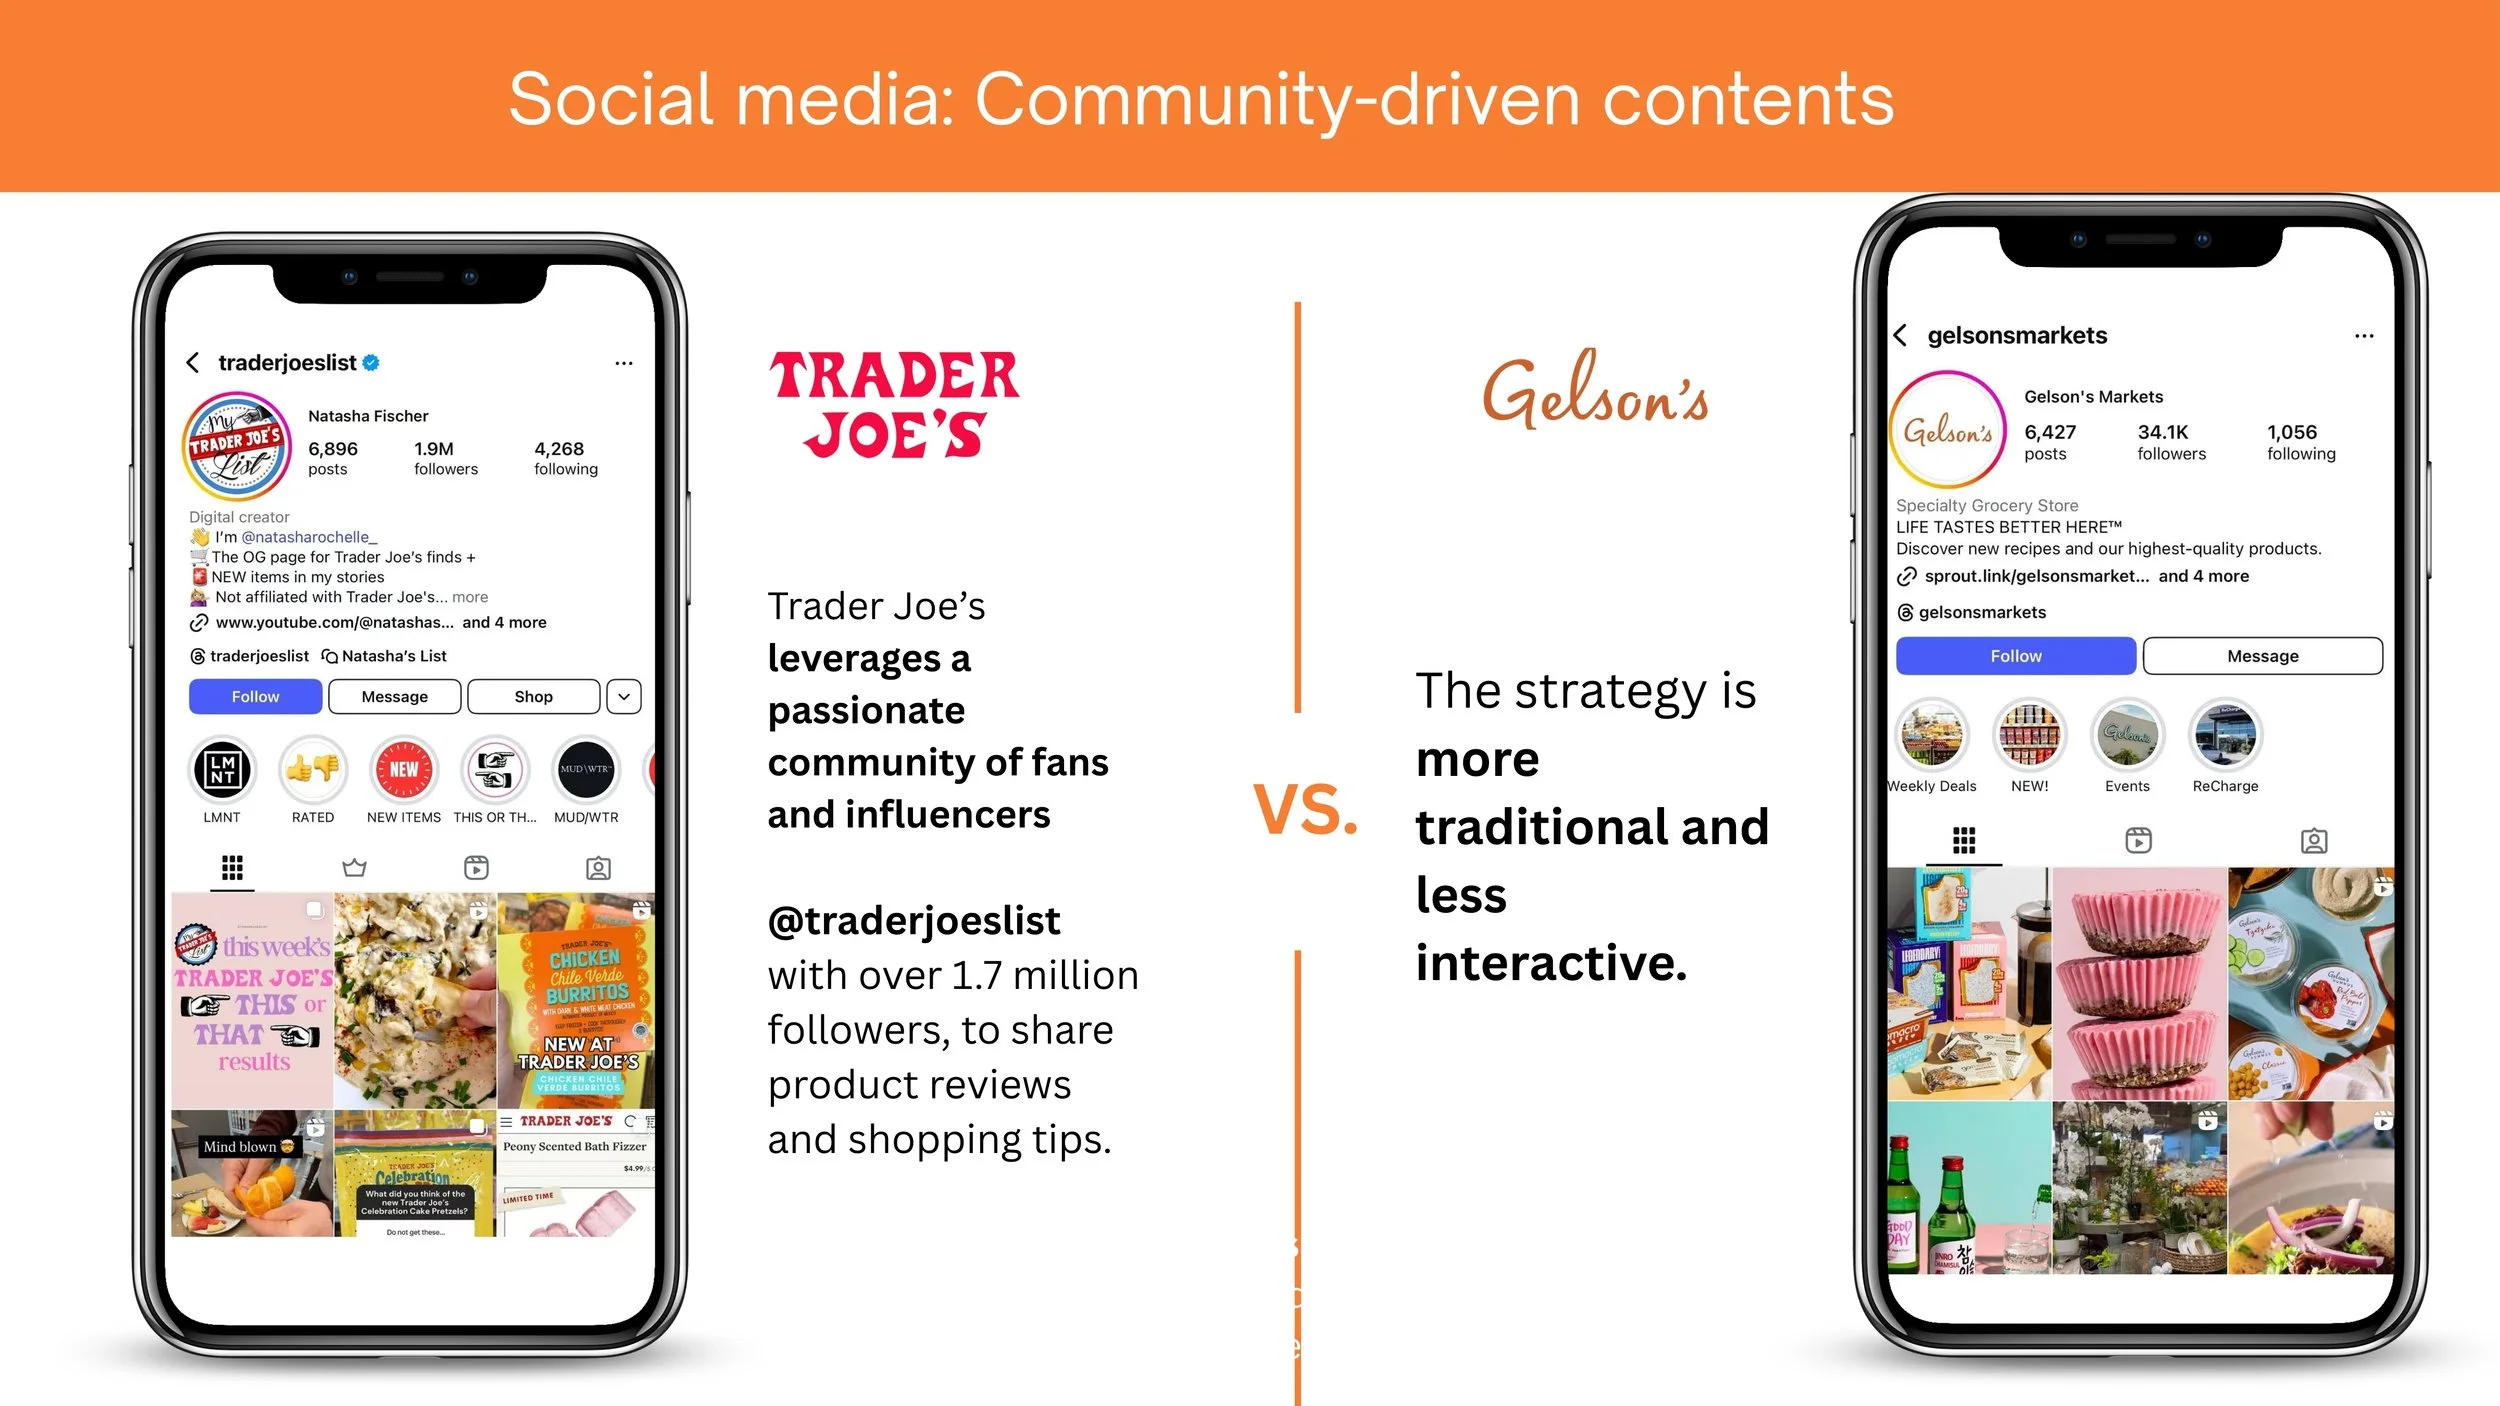
Comparison of social media accounts of Trader Joe's and Gelson's Markets, highlighting their different strategies for community-driven content versus more traditional and less interactive approaches, with images of their mobile social media profiles and posts.
A presentation slide titled 'Social media: Special selling point to differentiate' with an orange header. The slide discusses Gelson's Bakery as a hidden gem, highlighting a unique selling point and social media to boost awareness and hype. There is a small illustration of a woman and a quote about shopping at Gelson's. On the right, there is a black-and-white photo of a bakery display case with various pastries, and a standee featuring a chef and baker. The slide ends with the note 'Collab with Mamolo's Fine Pastries'.
Photo of the storefront for ReCharge by Gelson's, a grocery store, with a modern exterior, large glass windows, and a sign reading 'FRESH MARKET', with a person carrying a shopping bag walking outside.
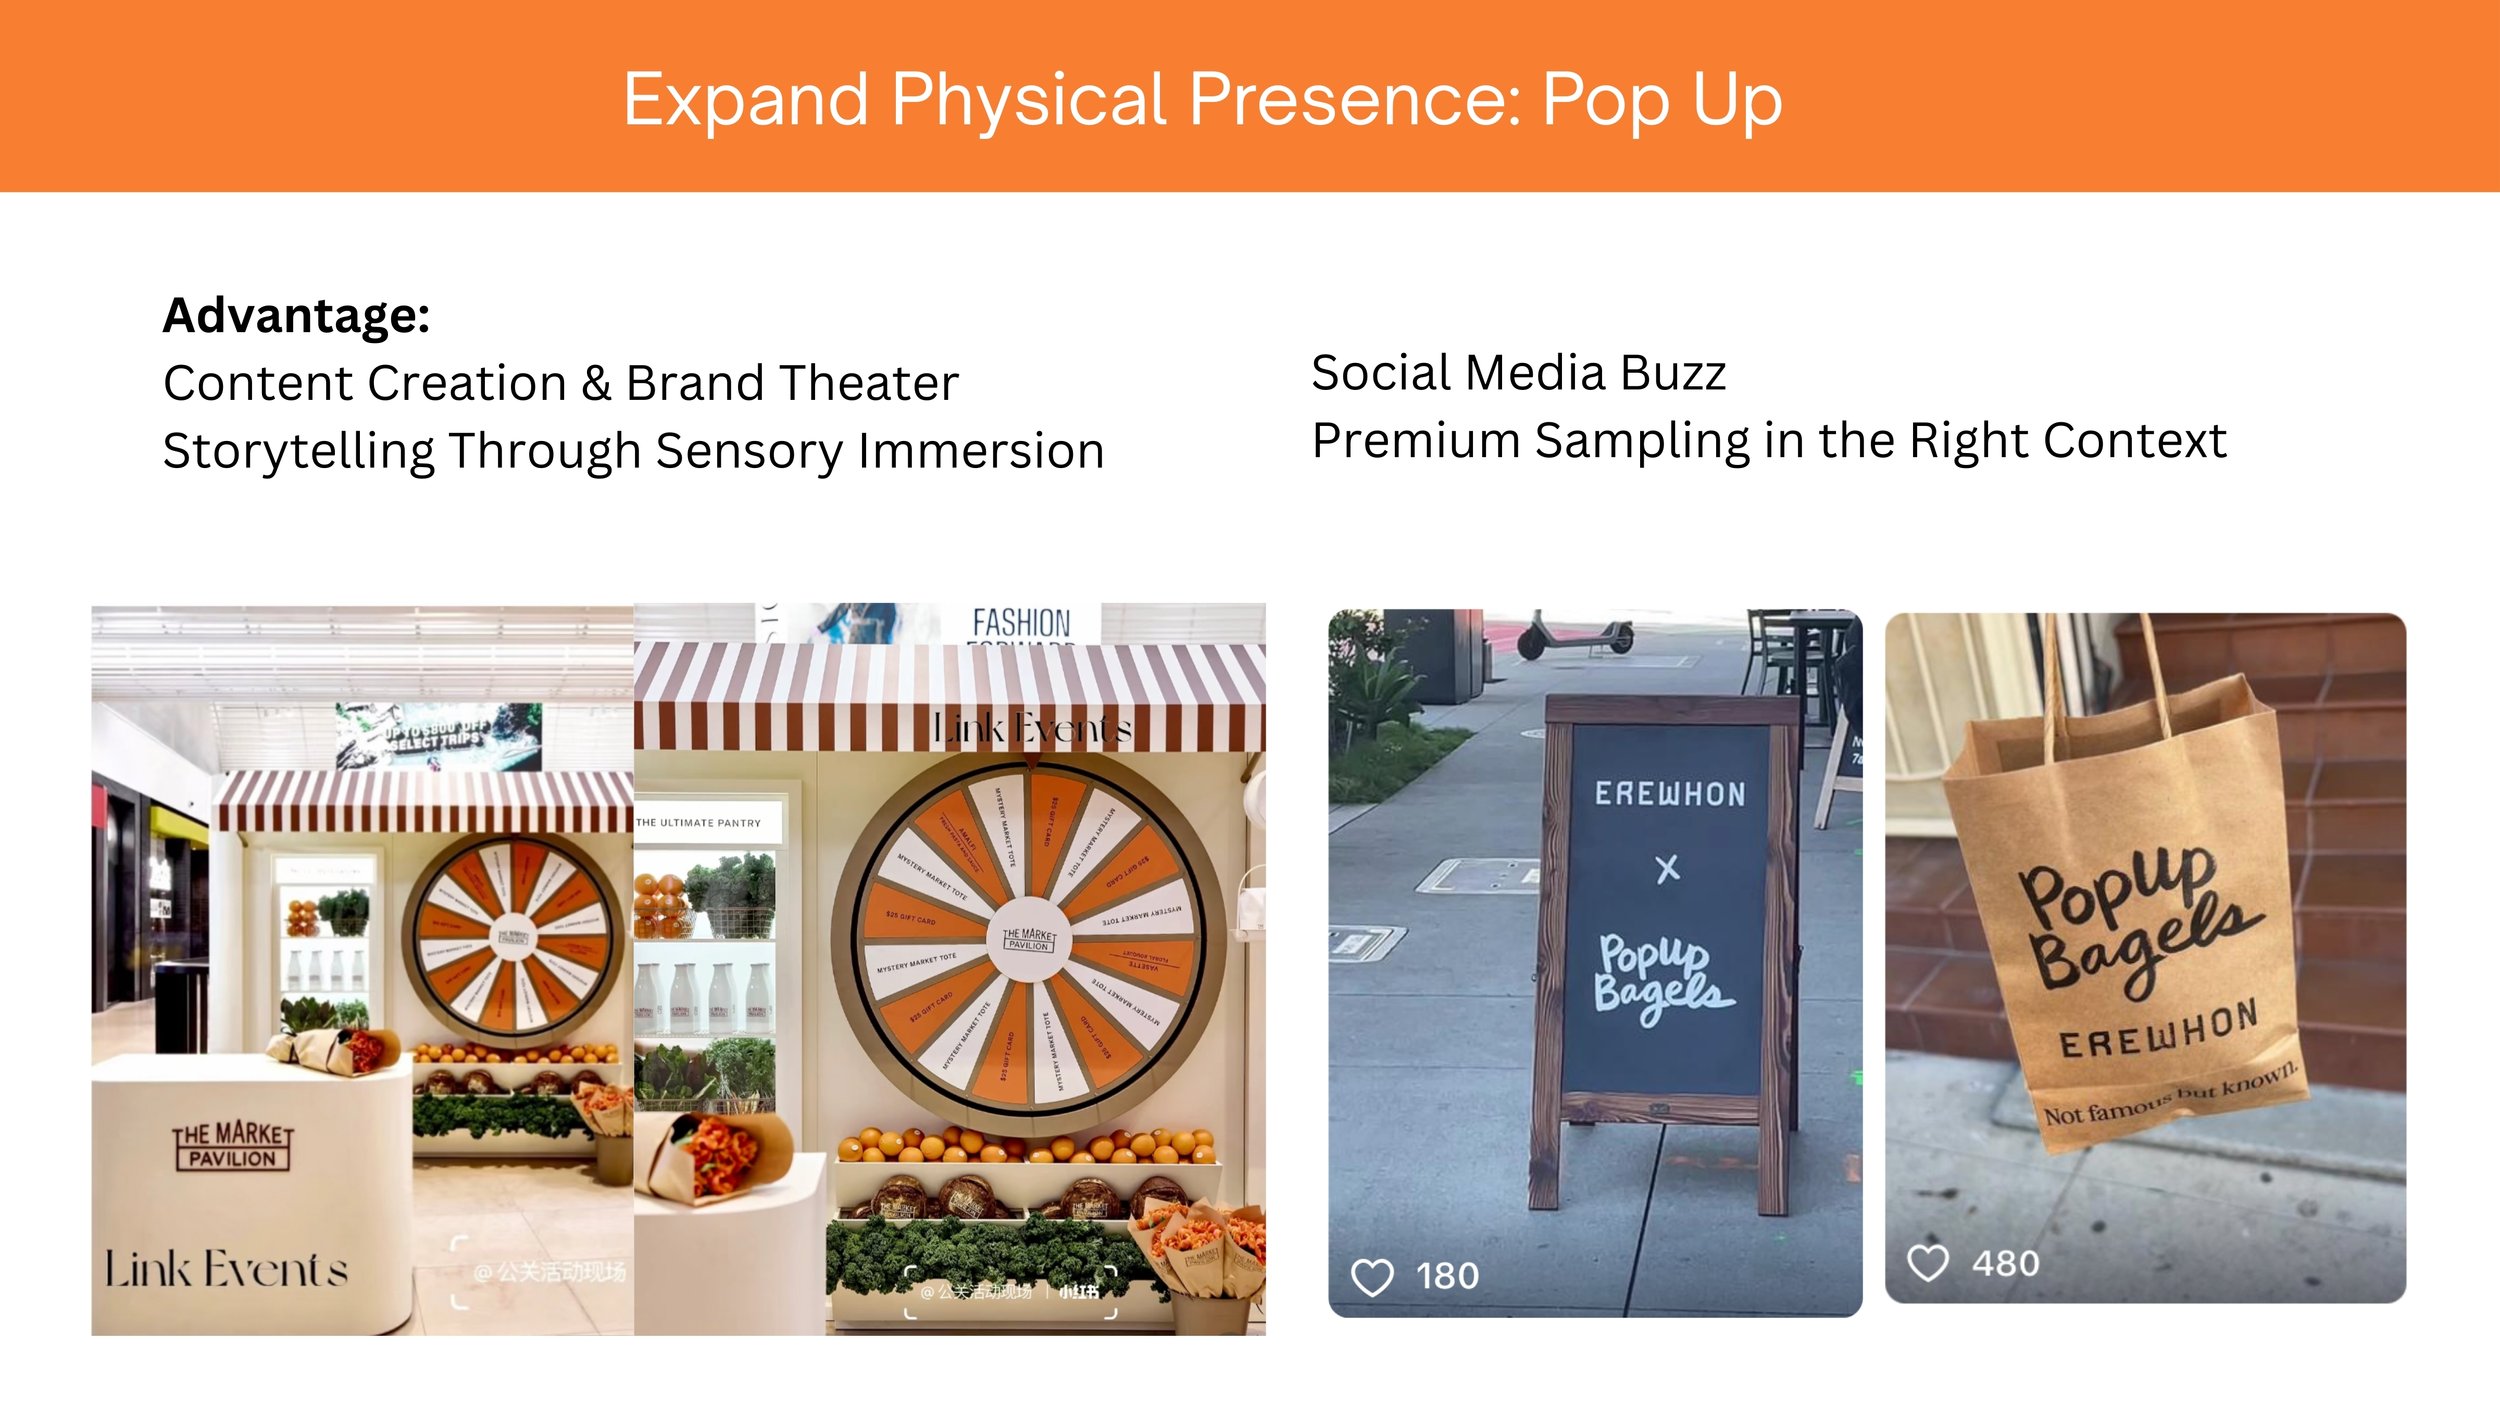
A presentation slide with the title 'Expand Physical Presence: Pop Up' and text explaining its advantages, including content creation, storytelling, social media buzz, and premium sampling, accompanied by images of pop-up market setups, signage, and shopping bags.